At RedMonk we track technology adoption trends in the industry, particularly from the lens of the developer and the practitioner. Our goal is to understand how software is being built, what tools are being used and why, and how all the pieces of the SDLC fit together.
In order to accomplish this we use any qualitative and quantitative information we can gather to piece the picture together. We talk to practitioners. We meet with all types of technology vendors. We read a lot – we keep up on the news, lurk on forums, read research papers, and subscribe to too many newsletters to count. And – when it’s available – we look at data.
None of these sources can give us a complete picture, but in the aggregate they help tell a story.
One of the pieces of analysis we regularly perform is the programming language rankings. Typically we run these rankings twice a year dating back to 2012. The goal of this analysis to use publicly available data sets to track if there are any meaningful changes in how people are using programming languages.
The full methodology is described here, but in brief we correlate cumulative language usage as seen through non-forked PRs on public GitHub repos against questions asked on Stack Overflow.
These metrics have always told an incomplete story at best. There are languages that were under- or over-represented by using public GitHub repos; there are communities that were under- or over-represented by looking at discussions happening in Stack Overflow. These metrics were not perfect by any means, but the two large, publicly facing datasets created an interesting decade plus long trend for RedMonk to track over time. Here’s how we’ve seen the language use change over time.
However, the veracity of the Stack Overflow data is increasingly questionable.
When we use Stack Overflow for programming language rankings we measure how many questions are asked using specific programming language tags.
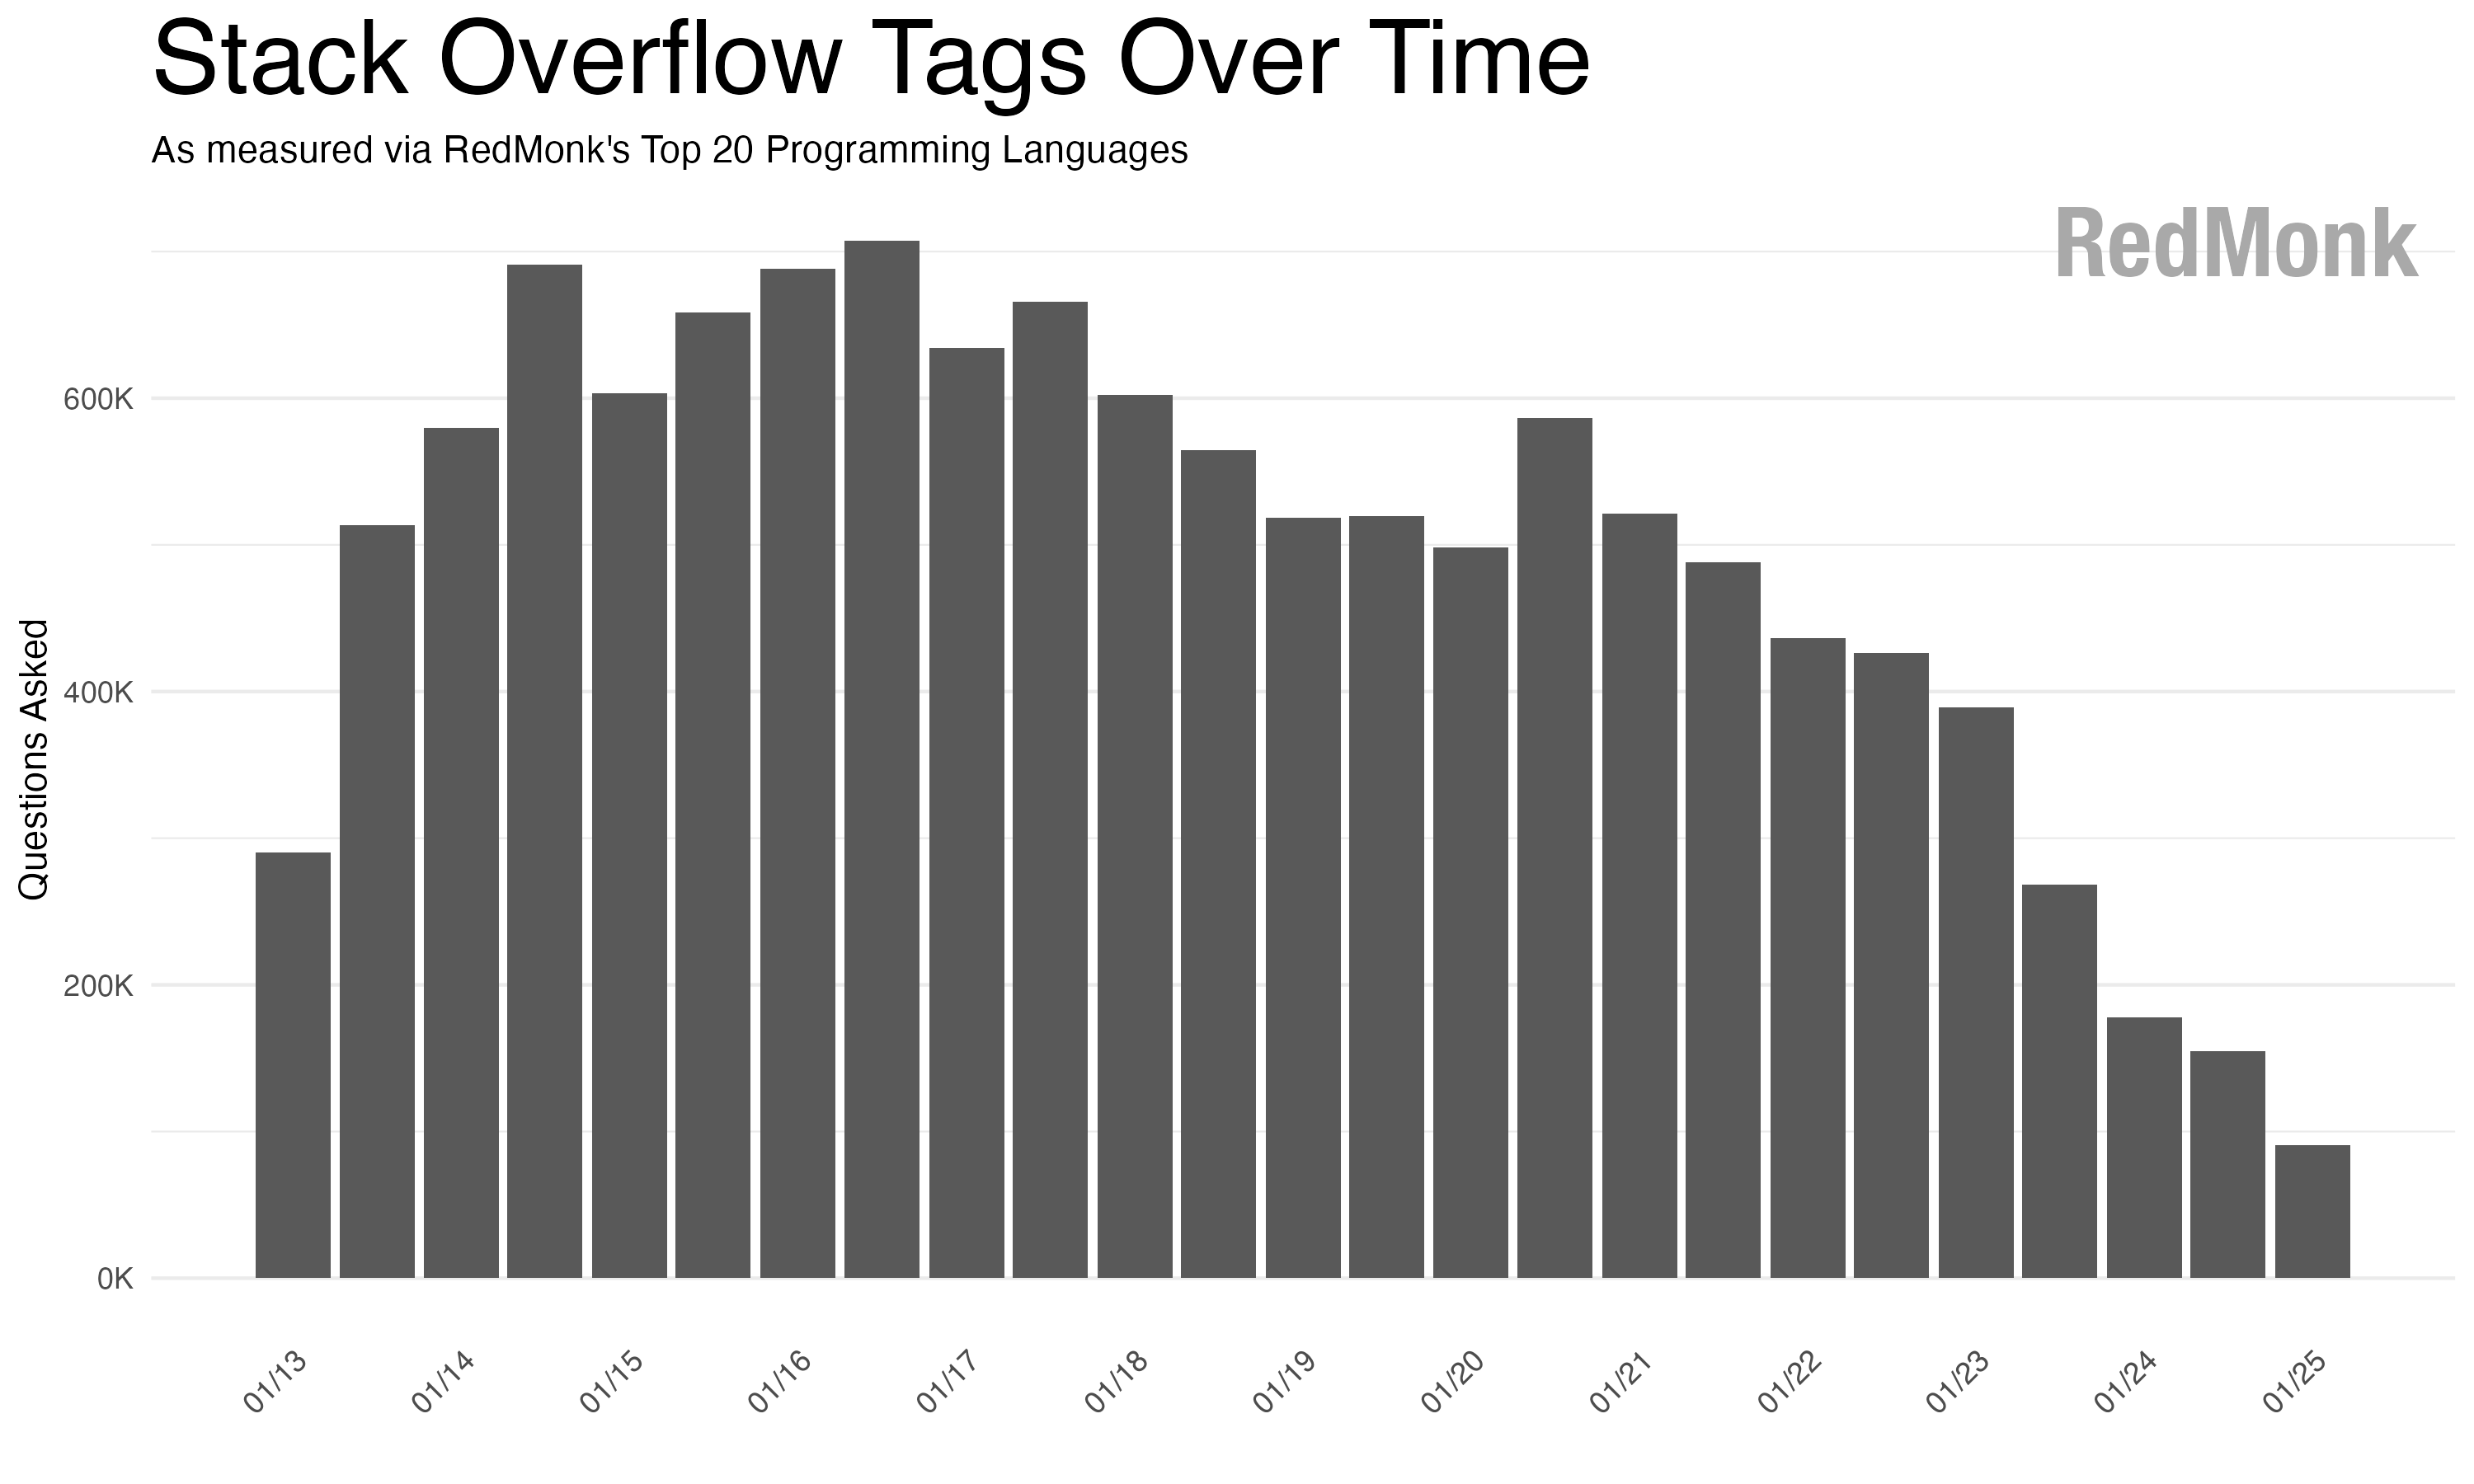
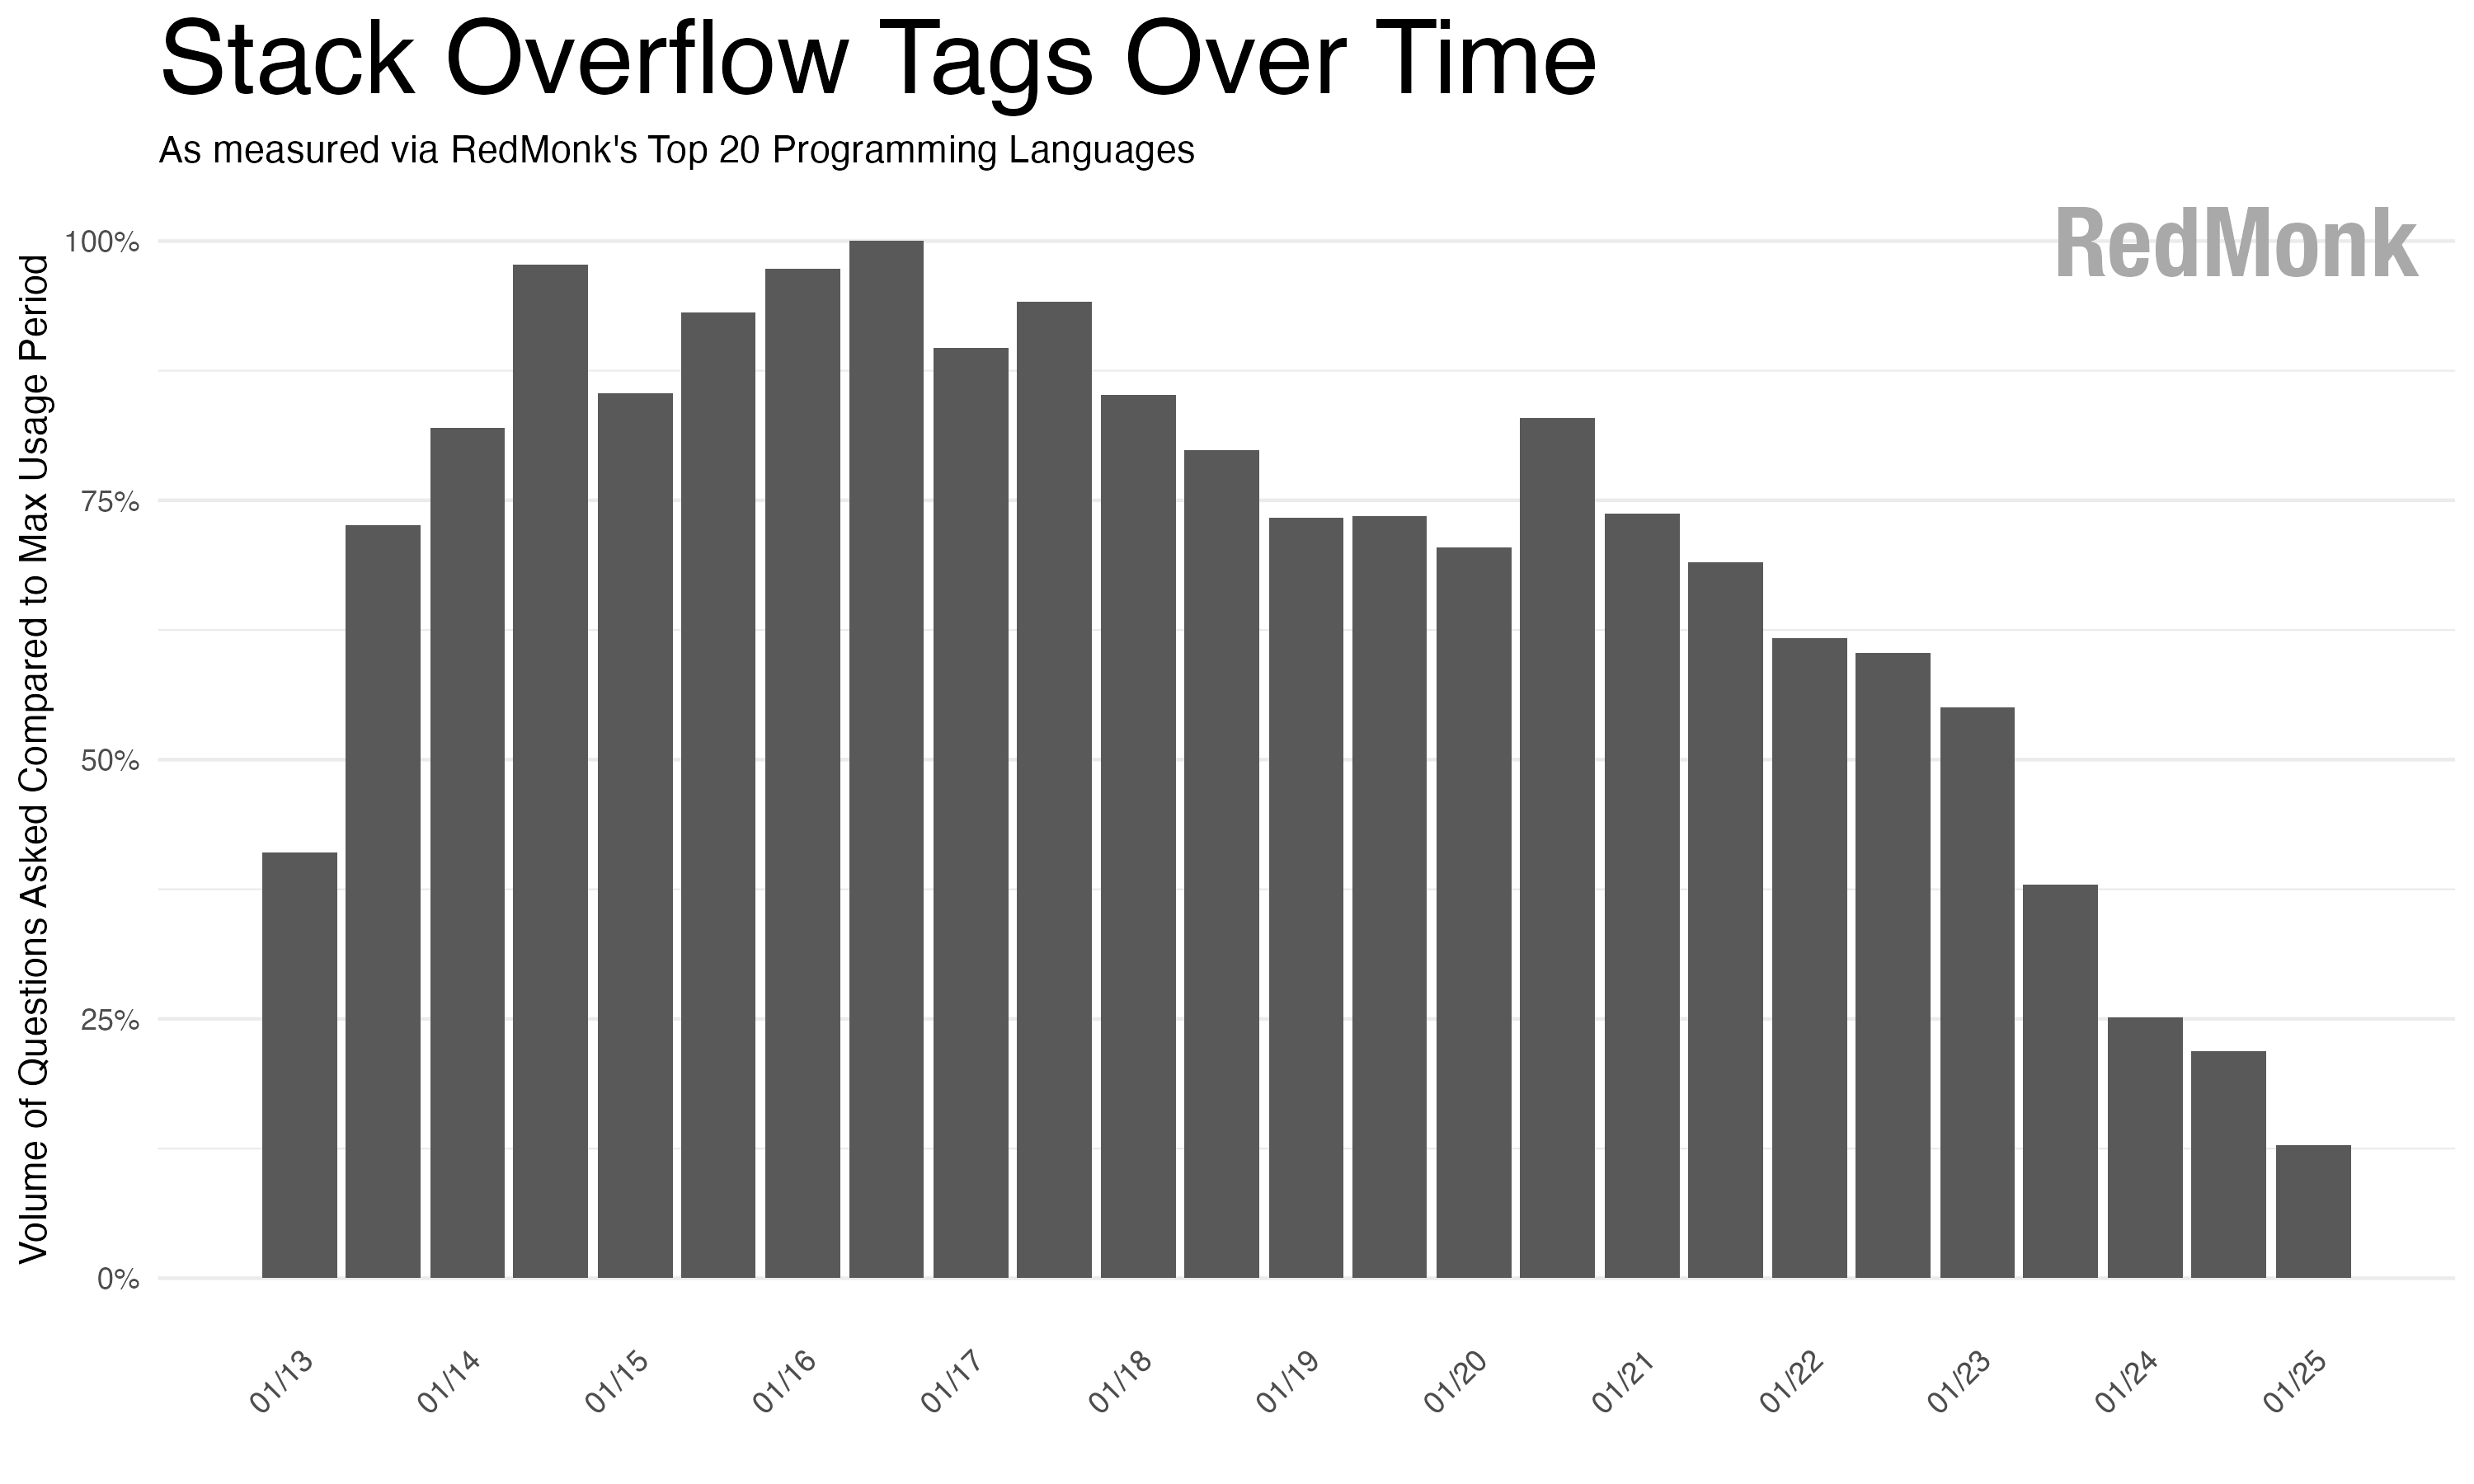
If you take the above top 20 programming languages for each time period and then aggregate the questions tagged, you get the below chart.
From this you can see that questions peaked in 2016 and have been in decline since. While other pieces, like Matt Asay’s AI didn’t kill Stack Overflow are right to point out that the decline existed before the advent of AI coding assistants, it is clear that the usage dramatically decreased post 2023 when ChatGPT became widely available. The number of questions asked are now about 10% what they were at Stack Overflow’s peak.
RedMonk is continuing to evaluate the quality of this analysis. On the one hand there is value in long-lived data, and seeing trends move over a decade is interesting and worthwhile. On the other hand, at this point half of the data feeding the programming language rankings is increasingly stale and of questionable value on a going-forward basis, and there is as of now no replacement public data set available. We’ll continue to watch and advise you all on what we see with Stack Overflow’s data.
.png)


