.png)

October 6, 2025
Swift Profile Recorder, an in-process sampling profiler for Swift services, is now available as an open source project.
Profiling is a powerful technique for understanding the performance, resource usage, and behavior of your applications. With Swift Profile Recorder, profiling can now be added to your Swift services by simply adding a package dependency and no additional setup. Swift Profile Recorder enables you to:
- Adopt profiling without extra privileges or system dependencies, allowing you to add profiling across a variety of compute environments with constrained permissions.
- Collect samples using curl, allowing you to easily read profiler output via an HTTP endpoint without needing to learn specific tooling like perf, sample, DTrace, or eBPF (bpftrace).
- Integrate with existing tools for visualization and analysis by supporting multiple industry-standard formats, including Linux perf script format, both the pprof file format as well as the /debug/pprof/profile endpoints, and also the collapsed format as used by the original FlameGraphs.
Apple has used Swift Profile Recorder at scale for several years as a tool for operating and debugging Swift services in production. Alongside the recent announcement of swift-parca, the Swift server ecosystem now has multiple profiling tools and approaches.
What is profiling and why does it matter? <?xml version="1.0" encoding="utf-8"?>
Profiling enables you to understand where your Swift application spends its time — whether it’s computing, waiting for a lock acquisition, or blocked in file I/O. Profiling is achieved by collecting samples of activity, which provide insight into how it’s being used.
Modern operating systems have tooling available to profile your applications or even the whole system. Examples include Apple’s Instruments, sample, and Linux’s perf. Furthermore, there are kernel systems like DTrace or eBPF that can be used to profile your applications.
The community recently contributed swift-parca, which plugs into Parca Agent, leveraging Parca Agent and eBPF on Linux to profile your application continuously. These samples are then aggregated on a centralized Parca server. This is a great tool which we hope many deployments can leverage today. But there are a few constraints which may impact wider adoption:
- Special privileges are required to attach to another process or load an eBPF/DTrace program into the kernel
- Linux distributions may require additional components to enable this functionality
- The available profiling technologies differ significantly between operating systems
To enable more teams to profile their applications, Swift Profile Recorder takes a different approach — it runs from within your process, implemented as a Swift Package. This means it can profile your code even in environments where external profiling tools can’t operate. You also won’t need to install other system components, you won’t need extra privileges, and the approach can work on different operating systems — right now Swift Profile Recorder supports macOS and Linux.
Apple extensively uses Swift on server to build distributed systems providing storage and compute at a huge scale. These systems power the build and test infrastructure for the development of Apple’s operating systems. Our client workloads are latency-sensitive, so we soon found a need to further instrument the code to understand performance bottlenecks.
This infrastructure runs in a sandboxed environment where we don’t have access to tools such as eBPF. Additionally, components of our infrastructure run atop macOS. So we built Swift Profile Recorder to give better insights into non-optimal code.
We use Swift Profile Recorder in two ways for the above infrastructure use case:
- To safely diagnose specific and isolated instances of performance regressions
- To gather a large number of samples across all of our infrastructure to identify common patterns, also known as Continuous Profiling
Adding Swift Profile Recorder to your application requires minimal setup:
Then, in your application’s main function:
Enable profiling through environment variables:
Assuming you specified configuration: .parseFromEnvironment() you will have to set an environment variable to activate the profiling server:
PROFILE_RECORDER_SERVER_URL_PATTERN=unix:///tmp/my-app-samples-{PID}.sock ./my-app
Collect samples with a simple curl command:
Visualization and Integration <?xml version="1.0" encoding="utf-8"?>
The generated profiles work seamlessly with popular visualization tools:
- Speedscope (speedscope.app): Drag and drop your .perf file for instant flame graph visualization
- Firefox Profiler (profiler.firefox.com): Upload your profile for detailed timeline analysis (example profile)
- Traditional FlameGraph tools: Use Brendan Gregg’s original FlameGraph scripts for custom visualizations
- Many other tools compatible with the common .perf, .pprof or stack collapsed formats
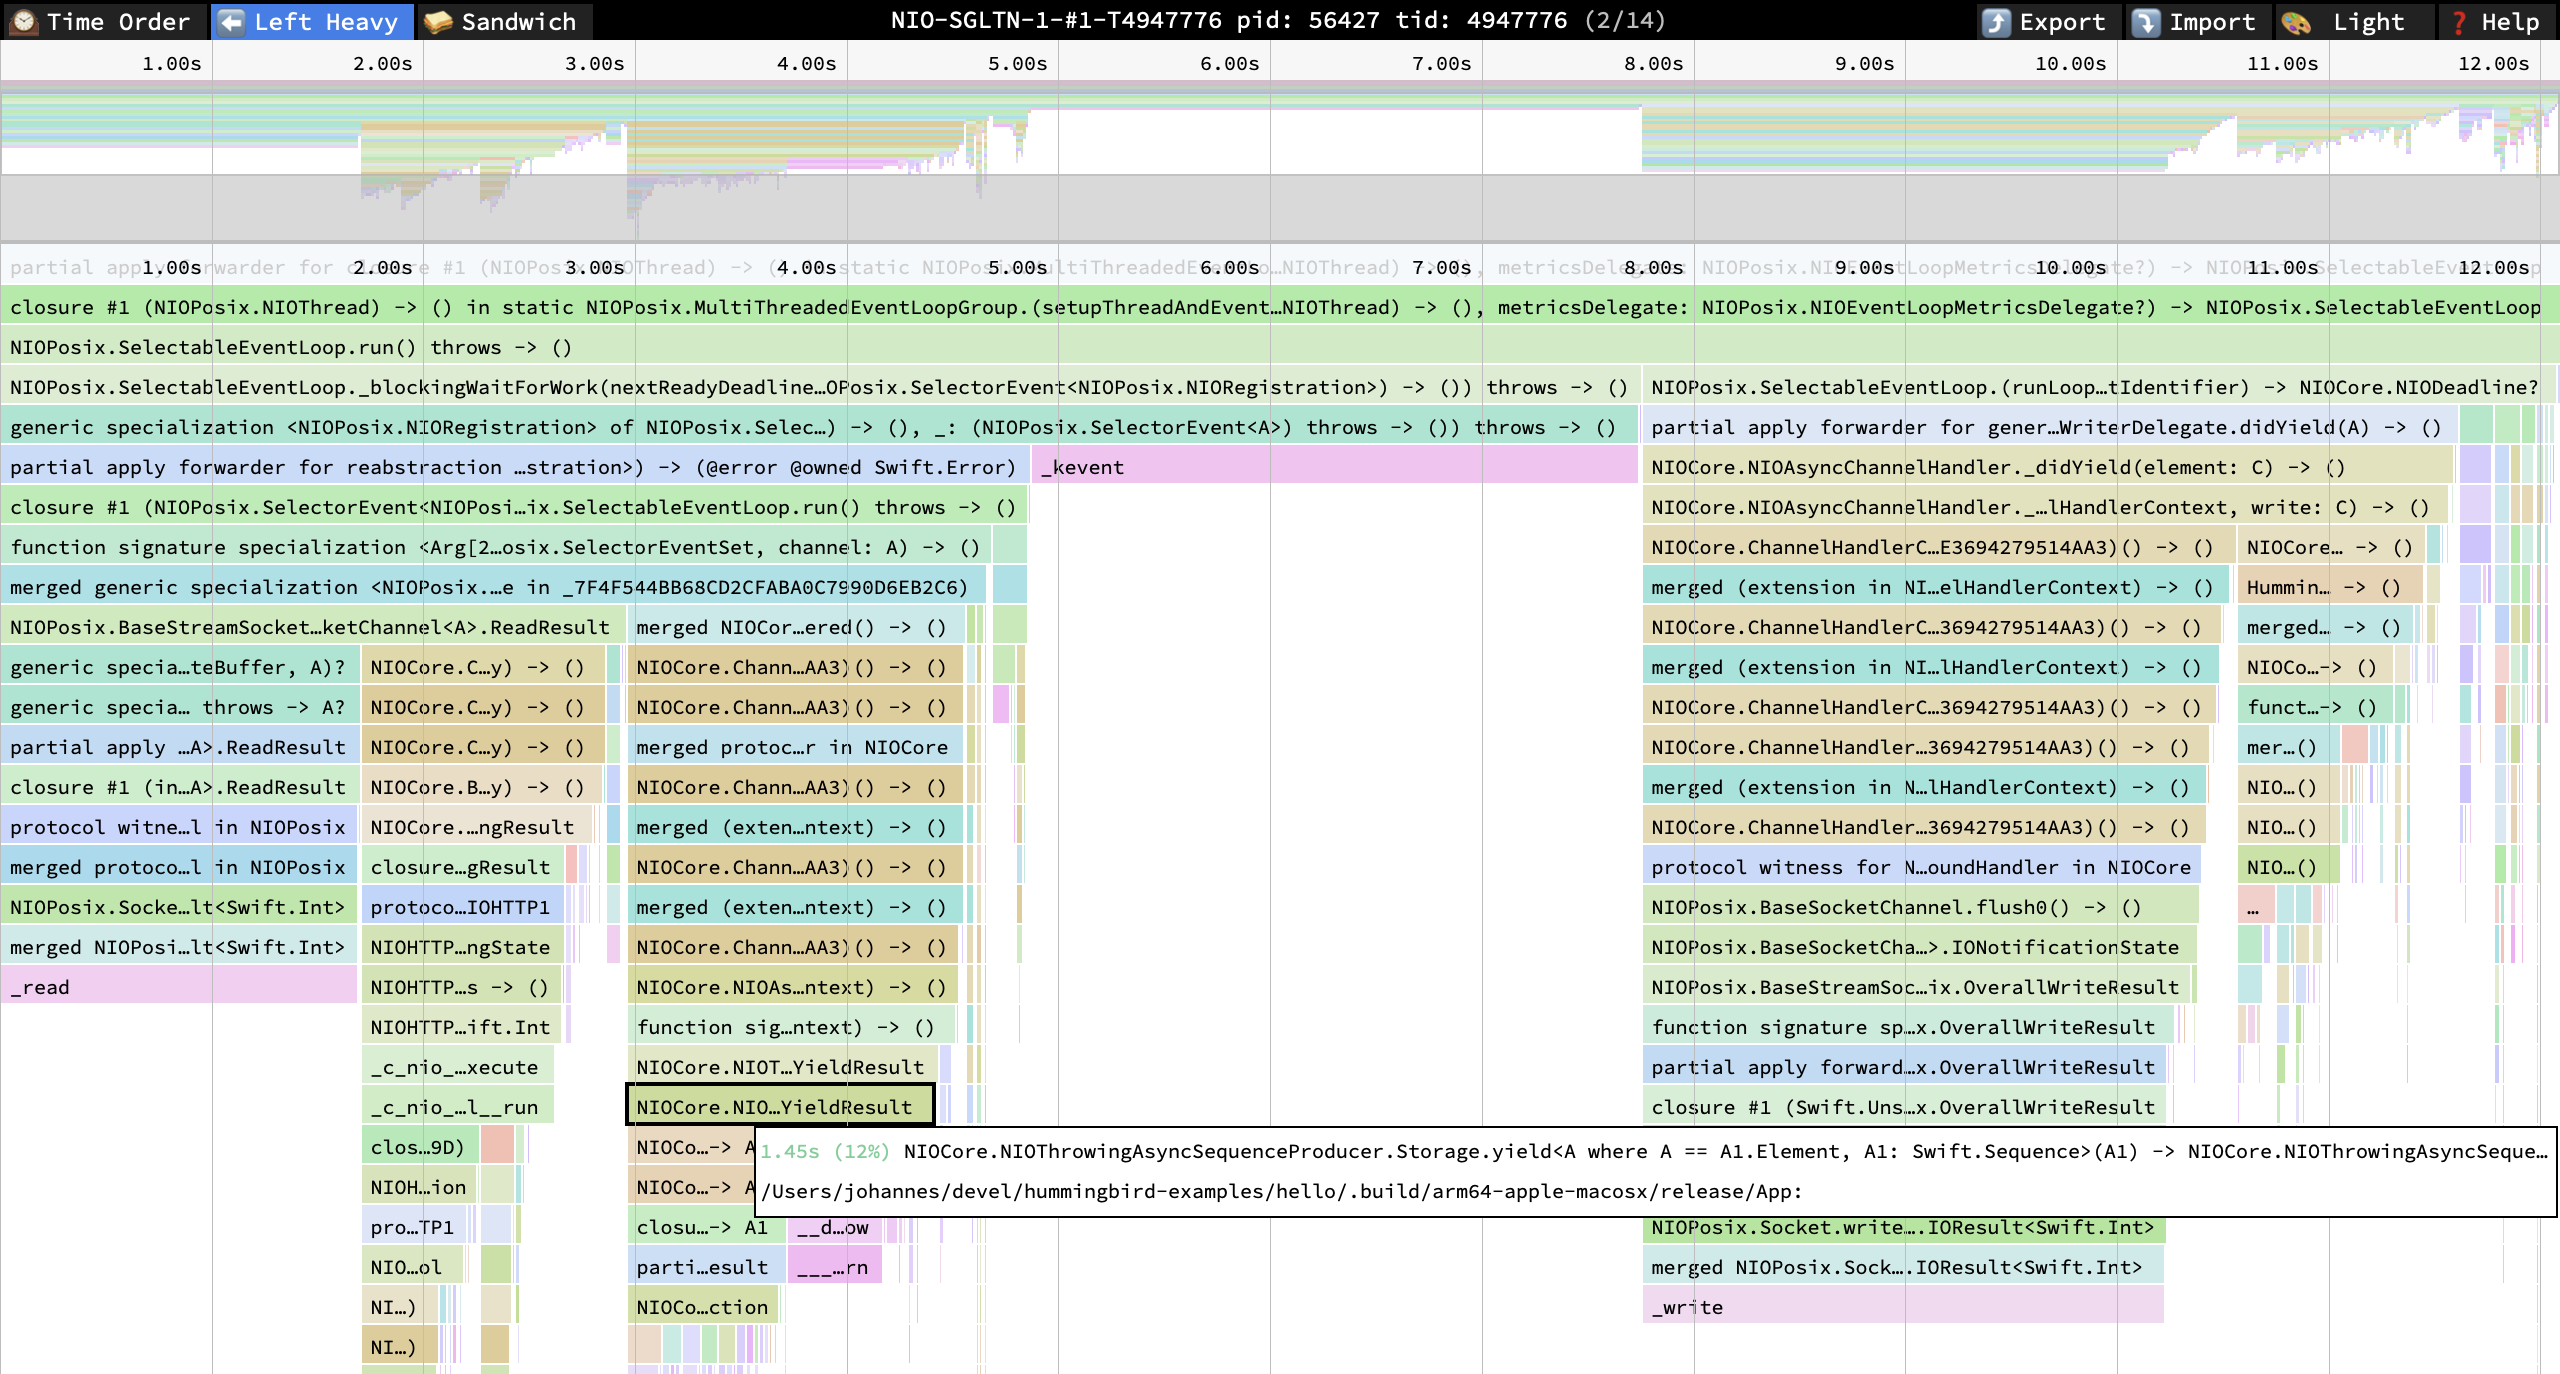
An example running Hummingbird’s hello example on macOS visualized in Speedscope can be seen below
Swift Profile Recorder can also be used a source to send samples to Parca as well as Pyroscope. If your production environment allows you to install system-wide profiling using eBPF, we would recommend to use Parca Agent together with swift-parca.
Community and feedback <?xml version="1.0" encoding="utf-8"?>
Swift Profile Recorder is an open source project and we’re eager to hear from the Swift community. Whether you’re running Swift applications in Kubernetes, investigating performance issues, or simply curious about where your application spends its time, we’d love to know how Swift Profile Recorder works for you. For example, it should be possible to integrate Swift Profile Recorder into a lambda function. We look forward to hearing how you use the profiler.
The project is actively developed and we welcome contributions, bug reports, and feature requests. As with any profiling tool, different applications and environments present unique challenges, and community feedback is essential for improving the profiler’s effectiveness across diverse Swift codebases.
Ready to start profiling? Visit the Swift Profile Recorder repository to get started. We also encourage you to discuss the project on the Swift forums, including asking questions about this post on the associated thread, and sharing your experiences in the Swift Profile Recorder category.
Authors
Johannes Weiss works on Distributed Systems in Swift at Apple.
Mitchell Allison works on Distributed Systems in Swift at Apple.
Continue Reading
-
The Growth of the Swift Server Ecosystem
September 23, 2025
Nearly ten years ago, Swift was open sourced and an official runtime for Linux..