.png)

In the last three decades, the world has made progress against extreme poverty faster than ever before. But unless the poorest economies start growing, this period of progress against the worst form of poverty is over.
In the last decades, the world has made fantastic progress against extreme poverty. In 1990, 2.3 billion people lived in extreme poverty. Since then, the number of extremely poor people has declined by 1.5 billion people.
This means on any average day in the last 35 years, about 115,000 people left extreme poverty behind.1 Leaving the very worst poverty behind doesn’t mean a life free of want, but it does mean a big change. Additional income matters most for those who have the least. It means having the chance to leave hunger behind, to gain access to clean water, to access better healthcare, and to have at least some electricity — for light at night and perhaps even to cook and heat.
Can we expect this rapid progress to continue?
Unfortunately, we cannot. Based on current trends, progress against extreme poverty will come to a halt. As we’ll see, the number of people in extreme poverty is projected to decline, from 831 million people in 2025 to 793 million people in 2030. After 2030, the number of extremely poor people is expected to increase.
To understand why the rapid progress against deep poverty will not continue into the future, we need to know why the world made progress in the past.
Extreme poverty declined in the last three decades because, back in the 1990s, the majority of the poorest people on the planet lived in countries that subsequently achieved very fast economic growth. In Indonesia and China, more than two-thirds of the population lived in extreme poverty. But these economies then grew rapidly, so that by today, the share has declined to less than 10%. Other large Asian countries — including India, Pakistan, Bangladesh, and the Philippines — also achieved strong growth, and as a consequence, the share living in extreme poverty declined rapidly. Much of the progress happened in Asia, but conditions in other regions improved too: the share living in extreme poverty also declined in Ghana, Cape Verde, Cameroon, Panama, Bolivia, Mexico, Brazil, and many other countries.
This chart shows the economic change in these countries over the past decades. As incomes increased, the share of people in extreme poverty declined.

What is different today is that the majority of the world’s poorest people are stuck in economies that have been stagnating for a long time. Consider the case of Madagascar. In the long run, the country has not seen any growth at all: GDP per capita in Madagascar is about the same today as it was in 1950. As a consequence, the number of people in extreme poverty increased in line with the country’s population growth. In richer countries, it is possible to reduce poverty by reducing inequality through redistribution, but a country like Madagascar cannot reduce its share of people in extreme poverty through redistribution. This is because the mean income is lower than the poverty line; if everyone had the same income, everyone would be living in extreme poverty.
The situation is similar in other countries, as the chart below shows: in the Democratic Republic of Congo, Mozambique, Malawi, Burundi, and the Central African Republic, more than half of the population lives in extreme poverty. As their economies have stagnated, the deep poverty that most people live in has remained largely unchanged for decades.
This is why we have to expect the end of progress against extreme poverty based on current trends. If the poorest economies remain stagnant, hundreds of millions of people will continue to live in extreme poverty.

I’m always skeptical when people say that we are at a juncture in history where the future looks much different than the past. But when it comes to the fight against extreme poverty, I fear it is true. Today, the majority of the world’s poorest people are living in economies that have not achieved economic growth in the recent past.
The projection below makes this difference clear: the future we can expect looks very different from the recent past.
This chart is based on the latest available projection made by the researchers at the World Bank.2 Up to 2030, this projection is based on the latest growth projections from the World Bank and the IMF. From 2031 onward, poverty projections are based on the average growth rates observed from 2015 to 2024.3
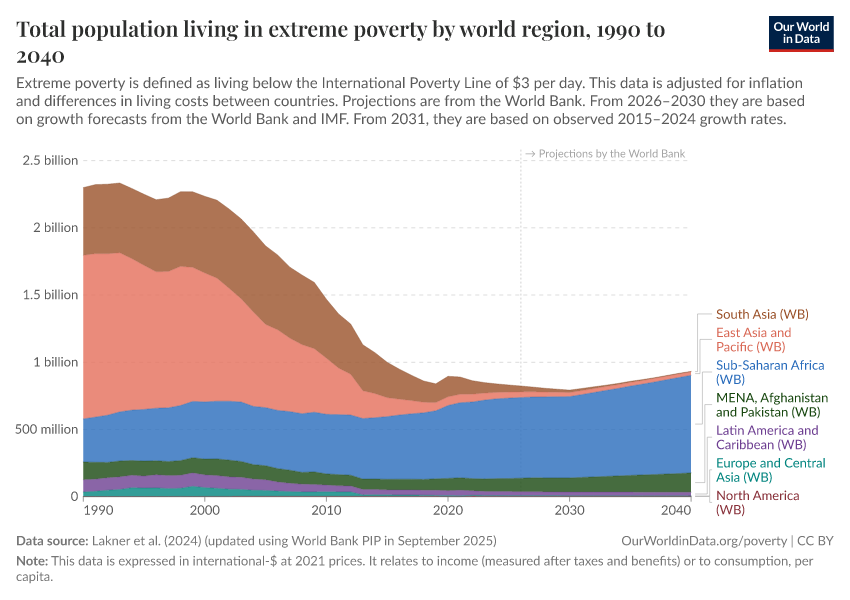
These projections show that we cannot expect a continuation of the strong decline of the past. After 2030, the number of people in extreme poverty is projected to increase.
Based on current trends, we have to expect the end of progress against extreme poverty.
The chart also shows how the geographic distribution of poverty has shifted. Three decades ago, most extremely poor people lived in Asia; today, most are in Sub-Saharan Africa. In the coming years, this trend is expected to continue. Growth in Asia will largely end extreme poverty in the region, while the economic stagnation and population growth in several African countries will mean that the number of people in extreme poverty there will stagnate or even increase.
Of course, this is not just a concern until 2040: without rising incomes in the poorest regions, extreme poverty will remain a reality.
The UN was right to make the “eradication of extreme poverty for all people everywhere” goal number one of the Sustainable Development Goals (SDGs). Unfortunately, the world is clearly not on track to achieve this most important goal.
Crucially, the expectations are dire for the very poorest regions in the world, but much less so for those who have left extreme poverty behind. Based on current growth, we can be optimistic that the world will continue to make progress relative to higher poverty thresholds. The number of people living on $5 or $10 a day will likely continue to decline. This is one reason why those who say the international poverty line needs to be higher are wrong. Economic growth is most important for the very poorest, and without a very low poverty line, we cannot see whether growth is lifting the poorest out of poverty. This is the reason we, at Our World in Data, have always published data on a wide range of definitions of poverty. One poverty line is not enough, and we need to rely on several poverty lines — higher and lower than the international poverty line — to understand how the world is changing.4
It’s no news that we should expect an end to progress against extreme poverty. This article is an update of an article I published in 2019, in which I wrote the same: the fact that the poorest economies are not growing means that the rapid progress against extreme poverty seen in the last decades will end.
Although this prospect has been known for years, it has hardly received the attention it deserves. Progress against extreme poverty was one of humanity's most outstanding achievements of the past decades — the end of it would be one of the very worst realities of the coming ones.
Importantly, however, these projections are not predictions; their purpose is not to describe what the world in 2030 or 2040 will certainly look like. These projections describe what we have to expect based on current trends; they tell us about our present world rather than the reality of tomorrow. Current trends don’t have to become future facts: many countries left extreme poverty behind in the past, because they had a moment at which they broke out of stagnation.5
What these projections tell us, however, is that if the poorest countries do not start to grow, a very bleak future is ahead of us: a future in which extreme poverty remains the reality for hundreds of millions for many years to come.
$3 a day: A new poverty line has shifted the World Bank’s data on extreme poverty. What changed, and why?
The international poverty line that defines extreme poverty was last updated in 2025. My colleagues Joe Hasell, Bertha Rohenkohl, and Pablo Arriagada explain in their article what this update means for the measurement and our understanding of extreme poverty.
Topic page: Poverty
You can find all our work on poverty on our dedicated topic page.
Acknowledgments
I would like to thank Bertha Rohenkohl, Pablo Arriagada, Simon van Teutem, and Edouard Mathieu for their helpful comments on drafts of this essay and the visualizations.
Note on the earlier version of this article
This is an update of an article that I published in May 2019 on Our World in Data, titled “As the world’s poorest economies are stagnating, half a billion are expected to be in extreme poverty in 2030”.
Based on even earlier projections, I also made this a central point of my presentation to the UN back in 2018, for which you can find my slides here.
Cite this work
Our articles and data visualizations rely on work from many different people and organizations. When citing this article, please also cite the underlying data sources. This article can be cited as:
BibTeX citation
![]()
Reuse this work freely
All visualizations, data, and code produced by Our World in Data are completely open access under the Creative Commons BY license. You have the permission to use, distribute, and reproduce these in any medium, provided the source and authors are credited.
The data produced by third parties and made available by Our World in Data is subject to the license terms from the original third-party authors. We will always indicate the original source of the data in our documentation, so you should always check the license of any such third-party data before use and redistribution.
All of our charts can be embedded in any site.