.png)

‘Build it, and they will come’ has long been repeated by cities seeking to promote sustainable mobility and increase bicycle ridership via the installation of bicycle infrastructure. Early cross-sectional research into this topic by Nelson and Allen found a significant association between additional miles of bicycle pathways per capita and increased bicycle commute mode share across 18 US municipalities, including several small college towns1. Dill and Carr assessed a more uniform set of 43 large US cities and found bicycle commute mode share to be positively and significantly associated with the presence of bicycle lanes2. Additional research has confirmed the positive relationship between bicycle lanes and bicycle ridership, especially for facilities that are part of a connected bicycle network3,4,5.
The above research establishes a link between standard bicycle lanes (SBLs) and bicycle commuters, but there is an immediate need to expand beyond SBLs to account for increasingly popular bicycle facility types such as protected bicycle lanes (PBLs), buffered bicycle lanes (BBLs) and shared-lane markings (more commonly referred to as sharrows; SHRs)6,7. While surveys have shown that potential riders’ stated preferences are for lower-stress bicycle facilities such as PBLs8,9, few studies have explored whether that preference translates to ridership. Existing research exploring ridership relative to newer bicycle facility types has consisted of limited geographic range (typically a single corridor or single city) and/or has examined individual bicycle facility types as opposed to a holistic study that compares all bicycle facility types10,11,12,13.
Moreover, the cross-sectional nature of the above papers introduces another research question: are bicycle facilities causing the high levels of bicycle commuting observed, or are bicycle facilities being installed in areas with high preexisting levels of bicycle commuting? Cross-sectional studies make it difficult to substantiate causality14, so a longitudinal study comparing changes in bicycle facilities over time with changes in ridership over time may provide insight into the above research question.
With this Article, we present a holistic examination of the relationship between different on-road bicycle facility types and bicycle commute ridership. More specifically, we collected 6 years of longitudinal bicycle facility installation data across 14,011 block groups in 28 US cities. For each facility type, we then explored bicycle commuting changes while controlling for socioeconomic status (SES) and built environment factors via three complementary analyses.
The first two analyses—analysis of covariance (ANCOVA) and difference-in-difference (DID)—designated block groups based on the lowest-stress bicycle facility installed in each block group between 2014 and 2019 (block groups could also be designated as ‘None’ if there were no bicycle facilities installed during the period). The ANCOVA explored changes in the number of bicycle commuters, whereas the DID explored changes in bicycle commute mode share. The third analysis—a multivariate regression—explored changes in the number of bicycle commuters while simultaneously accounting for the length of every bicycle facility type installed in each block group between 2014 and 2019. From lowest stress to highest stress, the bicycle facility types studied were PBLs, BBLs, SBL and SHRs.
The results from the first analysis—using ANCOVA at the block group level of geography—suggest that, after controlling for SES and built environment characteristics, block groups that installed PBLs experienced the largest increases in the number of bicycle commuters (Table 1). More specifically, block groups that installed PBLs, which we designated as PBL block groups, saw increases in the number of bicycle commuters that were 1.9, 1.8, 1.6 and 4.3 times larger than block groups whose lowest-stress bicycle facility installed was a BBL (BBL block groups), SBL (SBL block groups), SHR (SHR block groups) or ‘None’ (that is, block groups that installed no bicycle facilities), respectively. Block groups of all bicycle facility types had significantly larger increases in bicycle commuting than block groups that had no bicycle facilities installed. There were, however, no significant differences between the BBL, SBL and SHR block groups.
For the second analysis, we tested the same block group data using a DID approach, comparing changes in bicycle commute mode share in each facility type’s block groups with changes in block groups that had no bicycle facilities installed. This time, the BBL block groups experienced the largest increase in bicycle commute mode share (Fig. 1). Although PBLs were installed in block groups with the highest extant levels of bicycle commuting, the PBL block groups still experienced the second largest increase in bicycle commute mode share in the after period. Interestingly, the initial bicycle commute mode shares in the SBL block groups were similar to the BBL block groups, yet bicycle commute mode share growth was 42.2% stronger in the BBL block group than in the SBL block groups. SHRs also tended to be installed in areas with higher extant levels of bicycle commuting, but the SHR block group bicycle commute mode share increase was 30.4% weaker than the increase experienced in PBL block groups. Block groups for all the bicycle facility types experienced bicycle commuting growth between 60% and 220% stronger than block groups that had no bicycle facilities installed (see all DID P values reaching 95% statistical significance in Fig. 1).
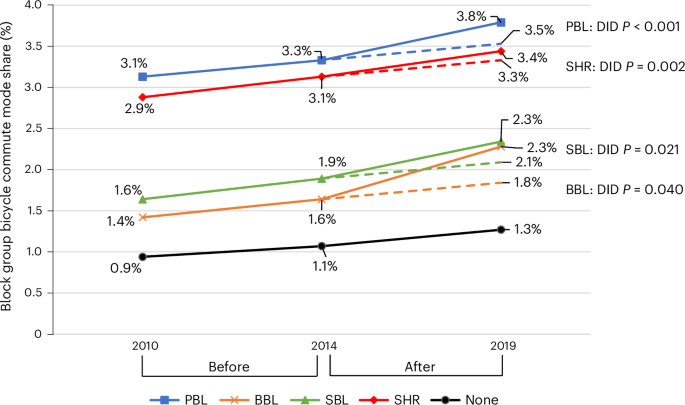
Solid lines are actual changes in bicycle commute mode share; dashed lines are estimated changes had facilities not been installed.
The third analysis—a multivariate regression—also explored longitudinal changes in the number of bicycle commuters by block group but simultaneously accounted for the mileage of all bicycle facility types installed between 2014 and 2019 while controlling for SES and built environment factors. The installation mileage of PBLs and BBLs had especially strong and significant relationships with increases in bicycle commuters at the block group level (Table 2). For an average-sized block group with average characteristics (that is, a commuter population of 687.2 commuters and a land area of 0.57 square miles), each additional mile of PBLs was significantly associated with 11.9 more bicycle commuters per block group and each additional mile of BBLs was associated with 14.0 more bicycle commuters per block group. Installation mileage of SBLs had a significant and positive relationship with bicycle commuters but was only 35–44% as strong as PBLs or BBLs. In other words, each additional mile of SBLs was associated with 6.9 more bicycle commuters per block group. The installation mileage of SHRs did not have a significant relationship with changes in ridership.
Results suggest that (1) cities that wish to encourage more biking activity seem justified in installing bicycle facilities toward that end, and (2) lower-stress bicycle facilities—such as PBLs and BBLs—tend to be significantly associated with larger increases in ridership at the block group level than higher-stress bicycle facilities such as SBLs and SHRs. While SHRs correlated with increased bicycle commuting relative to no new bicycling infrastructure in the initial ANCOVA analysis, the shift became weaker once accounting for extant levels of bicycle commuting in the second DID analysis, and then insignificant once other bicycle facilities were accounted for in the third multivariate analysis.
The results can be interpreted as a general validation of stress-based planning tools such as bicycle level of traffic stress15. Agencies have widely adopted bicycle level of traffic stress to assess their bicycle networks, frequently endeavoring to provide connected bicycle networks with the lowest possible stress level. This Article’s findings support this approach; cities that seek to boost bicycle commute mode shifts should focus on implementing low-stress bicycle facilities if they want to best facilitate the sizable population of less-confident potential riders16. Although higher bicycle mode share is not necessarily an end in itself, it could help cities to lower fuel consumption, emissions and transportation costs while providing more mobility options to a greater percentage of the population along with better health outcomes and better safety for bicyclists and nonbicyclist road users alike17,18.
Future research might examine various PBL characteristics in further depth such as the amount of separation, type of protection, and vehicle volume or speed of the adjoining roadway to examine their impacts on bicycle ridership. For example, do PBLs on large roadways with high vehicle volumes and speeds have less impact on potential ridership? Future research might also account for each facility’s place in the wider bicycle network to understand whether isolated lower-stress bicycle facilities are as impactful as connected lower-stress bicycle facilities. Furthermore, as different ages or genders may be more or less sensitive to different types of bicycle infrastructure, future work might explore how facility types are correlated with age or gendered ridership. Future research might also explore how quickly different bicycle facility types encourage additional ridership and for how long that additional ridership may last.
As cities’ commitments to promoting sustainable transportation through biking continue to evolve with more mature bicycle facilities and expanding bicycle networks, results of this study suggest more nuance to the old mantra ‘Build it, and they will come’ by unveiling a link between lower-stress bicycle facilities and larger increases in bicycle commuting.