.png)

Introduction
In this article, I share an experience that taught me that often the smallest details are enough to solve that big problem in a production system, or to improve the performance of a process that for some unknown reason is taking much longer than expected.
Context
Some time ago, I had to develop a task that seemed quite complex, at least to achieve a solution that truly met expectations, and it was basically to reduce the response times in one of the main flows of our application. Generally speaking, and to give you some context, the flow is shown below:
 Backend-level flow
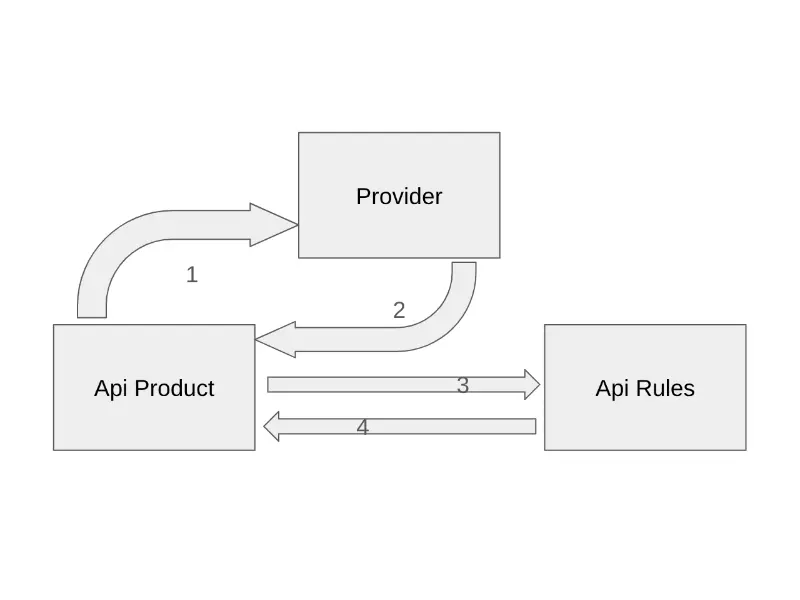
Broadly speaking, the backend flow consisted of the following:
- The product API requested the corresponding itineraries information from the provider
- The provider, which is a third-party API, processes the information and returns the corresponding itineraries to the product API
- Then the product API makes a request to the rules API, this API does some processing to determine which rule applies to each itinerary
- Finally, the rules API returns to the product API the rule that should be applied to each itinerary
You don’t need to understand what a rule is or the actual logic behind each of these processes, this is just so you get a general idea of the different components involved in this flow.
The first thing I did was to log the time each process took, always under the premise that the time the provider takes is not something I could control, so I had to focus on improving the flow in the product API or the rules API. Here came the first surprise: this process was taking up to 90 seconds in critical cases, when the provider took about 15 seconds to return the itineraries. In other words, we were adding a delay of 75 seconds on our side, something that definitely should be optimizable.
The first thing I did was, through logs, determine how long each process took. Here, to my surprise, I realized that there was a part of the flow, the one that applied price rules to each itinerary, that took more than half of the total time, so here was the bottleneck. Now let’s see what this part of the flow consisted of:
Let’s say this code was the main cause of the delay in the flow, and this is demonstrated below:
| Total | 48.4 |
| Get itineraries from provider | 8.6 |
| Get rules | 1.12 |
| Apply rules | 36.86 |
| Itineraries received | 890 |
The total time is a bit higher than the sum of the other times due to data transmission time between each API
As we can see, for this specific case, 890 itineraries were being processed, and the process of applying the rules took about 37 seconds, which represented more than 75% of the total flow time.
Several things started to catch my attention here:
- The process of applying the rules was running in parallel, so it wasn’t a problem of the process being sequential, but something was causing the delay for each iteration.
- The programming language we were using was Go, a language known for its efficiency and use of goroutines for handling concurrency, so there shouldn’t be a performance problem in this case.
- Each iteration basically consisted of data manipulation, that is, there were no asynchronous processes or external API calls that could be causing the delay.
The Surprise
I started to realize that when all itineraries had a rule assigned, the process was extremely fast, but when there were itineraries without an assigned rule, the process took much longer. This was strange because if an itinerary didn’t have an assigned rule, it was simply ignored and the next itinerary was processed. After a deeper analysis, I realized that when an itinerary didn’t have an assigned rule, a warning message was logged, and this message was causing the delay.
This is because, even though the processing is done in parallel, logging messages is not concurrent since the same buffer is used at the operating system level, and when you try to write to the buffer from multiple goroutines at the same time, a lock occurs that causes a significant delay. In this case, every time a warning message was logged, a lock occurred that affected the process’s performance.
Honestly, I never thought this would be the cause of the delay, and to be honest, when I removed the logs and saw the time difference, I couldn’t believe it. I even closed and reopened the project several times 😂 because I didn’t believe it. In the next table, I show you the times after removing the logs:
| Total | 13.75 |
| Get itineraries from provider | 9.57 |
| Get rules | 3.15 |
| Apply rules | 0.006 |
| Itineraries received | 900 |
As you can see, the process of applying the rules went from taking 36.86 seconds to just 0.006 seconds, that is, an improvement of more than 99%. This is something I definitely didn’t expect, and it taught me a very important lesson about the importance of small details in software development.
Proof of Concept
So you can verify what I’ve shown in this article, here’s a small code example you can run on your machine to see the time difference when logging messages from multiple goroutines:
If you run this code, you’ll notice that even though the second cycle runs each iteration in parallel, it takes significantly longer due to message logging.
See you soon
That’s all for this article. I hope it was useful to you, as it was a great experience for me that showed me that sometimes the most insignificant detail can be the cause of a big problem in a system. If you have any comments, feel free to leave them in the comments section. See you next time!