.png)

Over 2,000 developers asked, and we delivered.
Debugging in Zed is now a reality—and it's a big leap toward Zed 1.0.
Overview
We set out to build a debugger with three primary focuses:
- Fast: Spend less time context switching and more time debugging
- Familiar: In line with Zed's design language and supports everything expected from a typical debugger flow
- Configurable: You're able to customize the UI, keybindings, debug configurations and more
Out of the box, Zed supports debugging popular languages including Rust, C/C++, JavaScript, Go, and Python. With our extension system, Zed can support any debug adapter that implements the Debug Adapter Protocol (DAP).
To simplify the setup process, we've introduced locators, a system that translates build configurations into debug configurations. Meaning that you can write a build task once in tasks.json and reference it from debug.json — or, even better, rely on Zed's automatic configuration.
Zed automatically runs locators on built-in or language server-generated runnables, so in many cases you won't even need to write a debug configuration to get up and running.
We currently support locators for Cargo, Python, JavaScript, and Go, with more coming in the future. For more information on configuring a debug session, see our documentation.
Once in a debug session, Zed makes it easy to inspect your program's state, such as threads, variables, breakpoints, the call stack, and more.
The debugger panel is fully customizable too, just drag and rearrange tabs in whatever order you want; you can even move the debug panel around so it fits your workflow.
Zed also supports keyboard-driven debugging for users that prefer to keep their hands on the keyboard. You can step through code, toggle breakpoints, and navigate a debug session without ever touching the mouse.
A Special Thanks
The debugger started as a community-led project with some impressive stats: 8 months of development, 977 commits, and 25k+ lines of code. The community built the core foundation that made today’s launch possible.
Special thanks to Remco Smits for driving a lot of the heavy lifting on this project—your contributions have been critical to getting us here.
Under the Hood
Zed's debugger supports debugging a variety of languages through the Debug Adapter Protocol. But simply implementing the protocol wasn't enough—we needed an architecture that could scale to collaborative debugging, support extensions, and efficiently cache and manage responses from debug adapters.
To achieve this, we built a two-layer architecture: a data layer that communicates directly with the debug adapters, and a UI layer that fetches data from the data layer to render the interface.
This separation means the UI layer only requests what it needs, allowing the data layer to lazily fetch information and avoid unnecessary requests. It also makes the data layer solely responsible for maintaining session state, caching responses, and invalidating stale data. This architecture will make implementing collaborative debugging significantly easier, since the same UI code can be reused across multiplayer sessions—and we only send essential data across the wire, preserving bandwidth.
Supporting every debug adapter out of the box wasn't feasible—there are over 70 DAP implementations, each with its own quirks. To solve this, we extended Zed's extension API to support debugger integration.
Adding DAP support via an extension involves defining a custom schema that integrates with our JSON server, implementing logic for downloading and launching the adapter, processing debug configuration to add sane default values, and integrating with locators for automatic configuration. This design follows our approach to LSP extensions, giving extension authors full control to bring their own debug adapters to Zed with minimal friction.
We also wanted inline variable values to work out of the box. Surprisingly, the inline values request is a part of the Language Server Protocol (LSP) instead of the DAP. Using the inline values approach would limit Zed to only showing inline values for DAPs which integrate with LSPs, which isn't many. A naive workaround might be to use regular expressions to match variable names between the source code and debugger values, but that quickly breaks down when dealing with scopes, and comments. Instead, we turned to Tree-sitter. After all Zed is built by the creators of Tree-sitter!
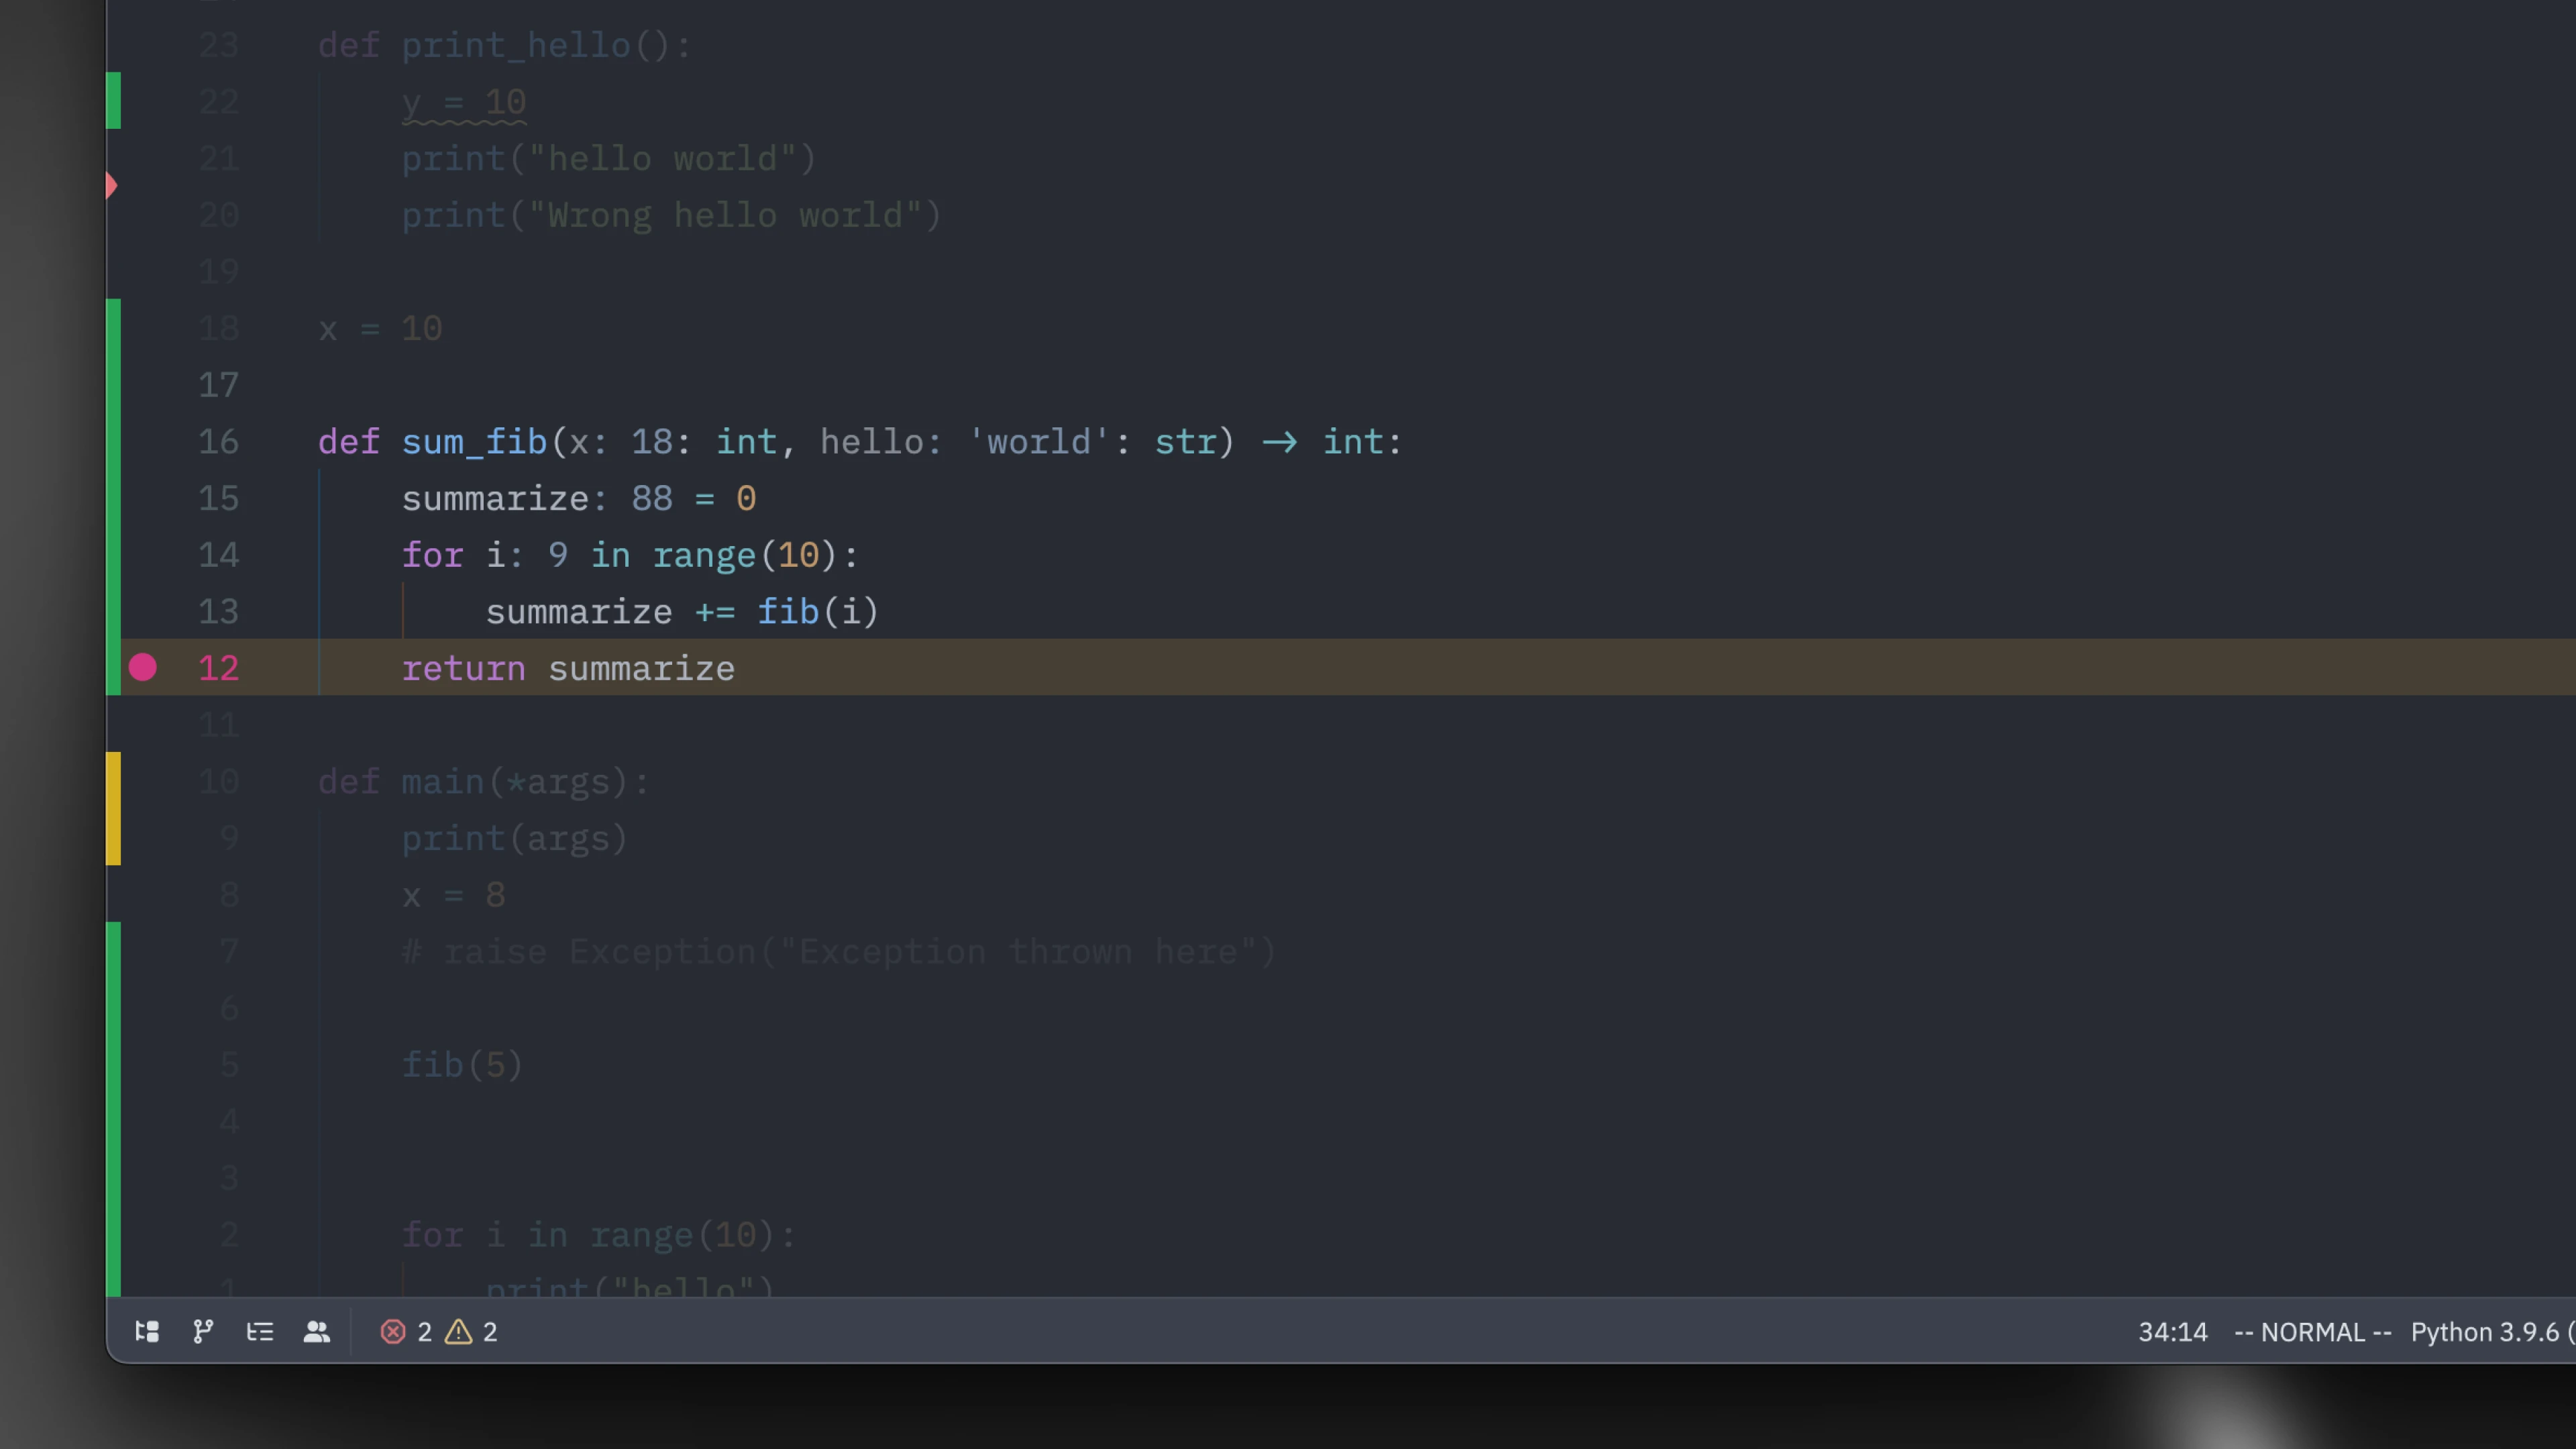 An inline value example.
Through Tree-sitter queries, we can accurately identify variables within the current execution scope, and easily support any language through .scm files without relying on an LSP server to be tightly integrated with a debug adapter. At launch, inline values are supported for Python, Rust, and Go. More languages will be supported in the coming weeks.
What's Next
When we set out to build the debugger, we wanted to make it seamless to use, out of the way, and in line with Zed's high standard of quality. Now that we've built a strong foundation that is compatible with any debug adapter, we're ready to explore and implement advanced features such as:
- New views: While we support all the fundamental views, we're planning on adding more advanced views such as a watch list, memory view, disassembly view, and a stack trace view
- Automatic configuration: We're going to add support for more languages and build systems
- Polish and more: reach out to us on Discord or on Zed's GitHub repo to let us know!


