.png)

Vercel gives you some observability out of the box for your NextJS application: function logs, perf insights, basic metrics. But as your app grows, the cracks start showing.
- No End-to-End Traces: You get function-level timings, but not the full request lifecycle across middleware, DB calls, and third-party APIs.
- Locked In: Logs and metrics stay tied to Vercel. Want to move infra or test locally? Too bad.
- Zero Custom Instrumentation: Can’t trace auth flow timing, cache performance, or business-critical logic.
- No Service Correlation: Can’t trace calls across microservices, queue workers, or even a database hop.
- Weak Debug Context: No slow query breakdowns. No cache hit/miss metrics. No idea why stuff is slow.
At this point, you’ll likely explore Jaeger or Datadog. But:
- Jaeger: Great for tracing, useless for metrics and logs.
- Datadog: Full-featured—but don’t blink, or your bill will triple.
This guide walks through how to instrument a Next.js app using OpenTelemetry, explains Jaeger’s limits, and shows how SigNoz gives you a complete observability pipeline—without breaking the bank.
You might think: “My app’s just pages and API routes. Why trace anything?”
But Next.js isn’t simple. It just looks simple.
Next.js runs on multiple layers:
- Multiple environments - Node? Edge? Browser? each with its own quirks.
- Hybrid rendering: SSR, SSG, ISR—each with different bottlenecks.
- Middleware: Runs on every request.
- API routes: Mini backends.
- Client/server boundaries: Blurred, dynamic, often hard to trace.
Without instrumentation, you're flying blind.
User says: “The dashboard is slow.”
Without tracing: Stare at server logs. Hope for a clue.
With tracing: 50ms render + 3s wait on a third-party API. Case closed.
API crashes randomly.
Without tracing: Try to reproduce locally. Maybe cry.
With tracing: DB timeout after 12 retries—problem found.
Site feels slower after latest deploy.
Without tracing: Play “spot the difference” in DevTools.
With tracing: New query in Server Component adds 200ms—roll it back or optimize.
Bottom line: Instrumentation turns debugging from guesswork into precision diagnosis.
Let’s start with something non-trivial. We'll use the official with-supabase example - it’s got real user auth, DB reads/writes, and third-party API usage. Exactly the kind of app where observability shines.
Update .env.local:
Output should look like:
Open http://localhost:3000 and test signup, login, and protected routes.
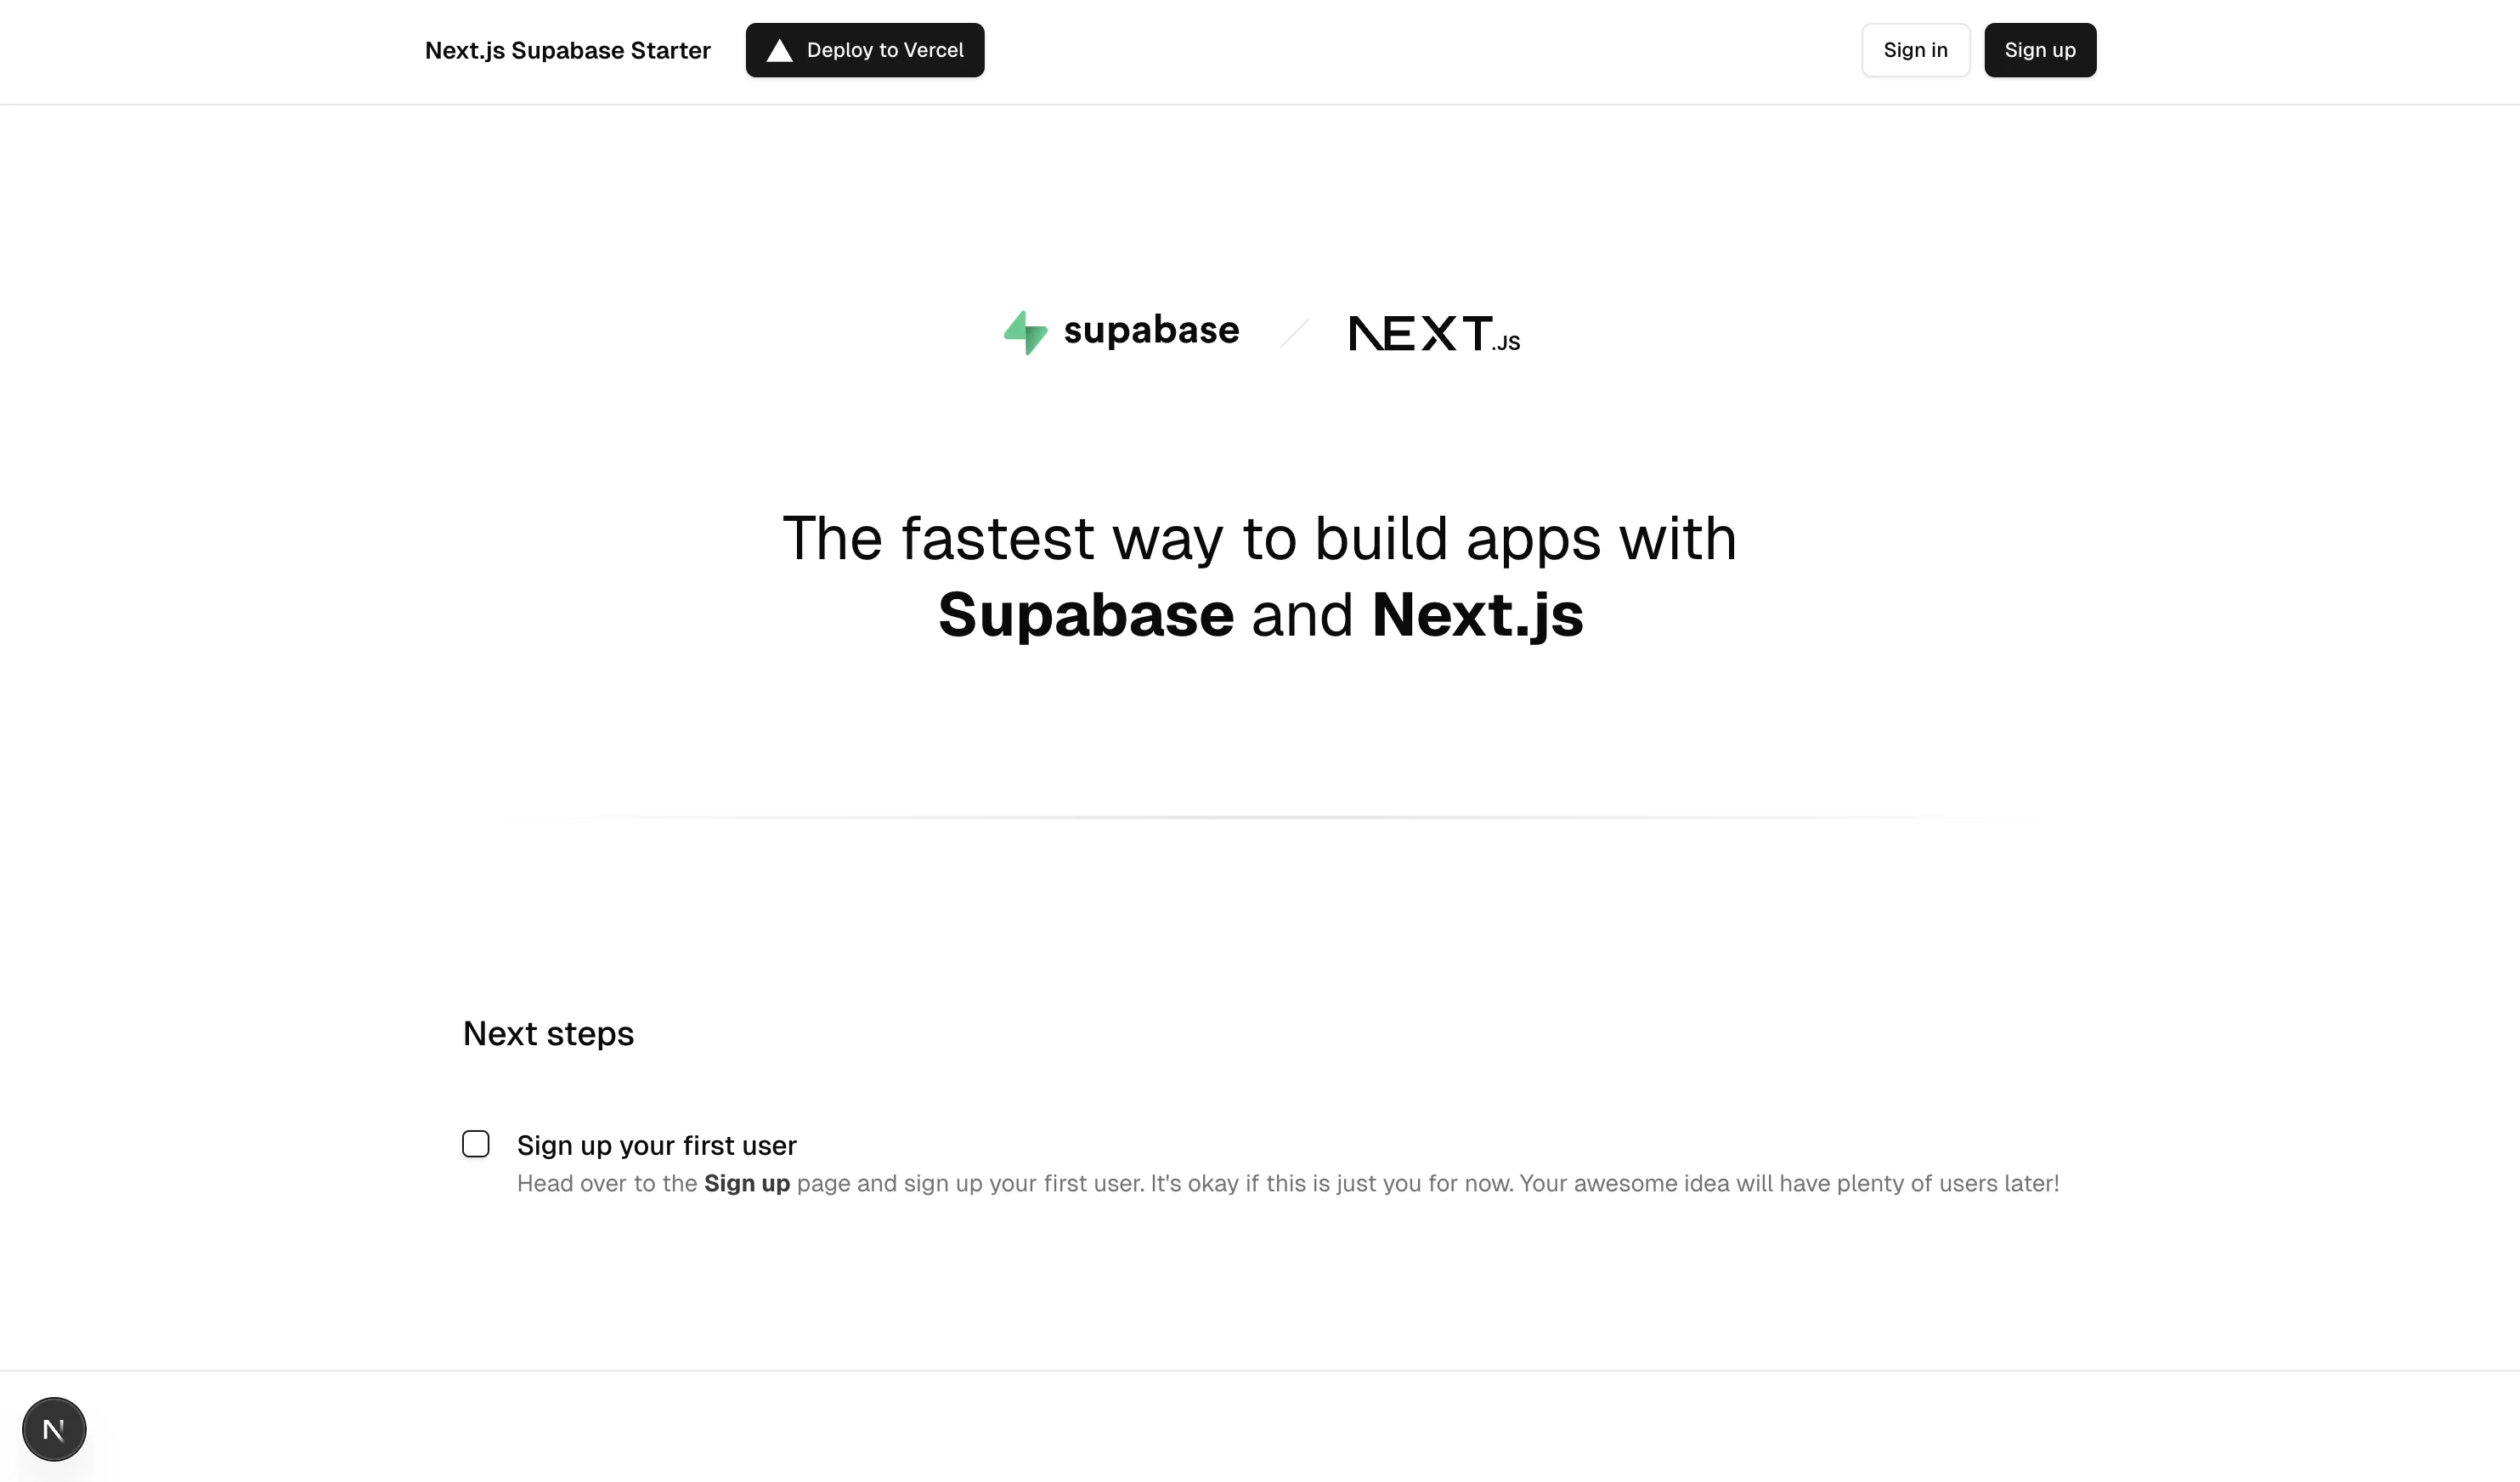 NextJS + Supabase Template Project
- Auth system: Signup, login, password reset, session flow
- Mixed rendering: SSR, SSG, API routes, Client Components
- Real DB operations: Auth, user management
- External APIs: Supabase
- Middleware: You can add some, we’ll instrument it later
This isn’t “hello world.” It’s mimics production-grade complexity—ideal for tracing, metrics, and debugging in the real world.
Note: In this guide, we will be using different ports (3000, 3001) across the sections. Ensure you are using the port as per your system.
Time to wire up OpenTelemetry into your app. We'll follow the official Next.js guide and use @vercel/otel, which is the preferred path for most setups.
It supports both Node and Edge runtimes, comes with sane defaults, and is maintained by the Next.js team, so no need to reinvent the wheel unless you really want to
Create a file named instrumentation.ts at the root of your project (or the src folder if you are using it):
This hook auto-registers tracing across your entire app - including API routes, page rendering, and fetch calls.
The serviceName shows up in your tracing backend (Jaeger, SigNoz, etc.) and helps separate services in a distributed system
This step is only needed when using NextJS 14 and below:
Because it just works—with minimal boilerplate.
Benefits:
- Auto-detects Node.js vs Edge environments
- Pre-configured with smart defaults
- Maintained by the Next.js team
- Simple to install, easy to maintain
Then go manual:
This gives you full access to the OpenTelemetry Node SDK, but you’ll be responsible for configuring everything—exporters, propagators, batching, etc by creating your own instrumentation.node.ts file as explained in the official documentation
3. Run It and Verify
Start your dev server:
You should see something like:
Trigger a trace:
Next.js comes with solid OpenTelemetry support out of the box. Once you enable instrumentation, it automatically generates spans for key operations—no manual code required.
According to the official docs, here’s what you get by default:
All spans follow OpenTelemetry’s semantic conventions and include custom attributes under the next namespace:
| next.span_type | Internal operation type |
| next.span_name | Duplicates span name |
| next.route | Matched route (e.g. /[id]/edit) |
| next.rsc | Whether it's a React Server Component |
| next.page | Internal identifier for special files |
- HTTP Requests
Type: BaseServer.handleRequest
What you get: method, route, status, total duration
- Route Rendering
Type: AppRender.getBodyResult
Tells you: how long server-side rendering took
- API Route Execution
Type: AppRouteRouteHandlers.runHandler
Covers: custom handlers in app/api/
- Fetch Requests
Type: AppRender.fetch
Covers: any fetch() used during rendering
Tip: disable with NEXT_OTEL_FETCH_DISABLED=1
- Metadata Generation
Type: ResolveMetadata.generateMetadata
Tracks: SEO-related dynamic metadata costs
- Component Loading
Types:
- clientComponentLoading
- findPageComponents
- getLayoutOrPageModule
Insight: Which modules are loaded, how long it takes
- Server Response Start
Type: NextNodeServer.startResponse
Why it matters: measures TTFB (Time to First Byte)
- Pages Router Support (legacy)
Still using getServerSideProps or getStaticProps? Next.js instruments those too.
Without writing a single line of tracing code, you now get:
- Request and route-level performance
- Server rendering + metadata overhead
- External API call timings
- Component/module load times
- TTFB and response latency
It’s a solid start—but you still need somewhere better than Jaeger to actually work with these traces at scale.
Need to see more detail?
You’ll get verbose span logs in the terminal—useful when debugging instrumentation issues.
Next: These traces are only local for now. Let’s plug in a collector and pipe them to something visual - starting with Jaeger.
Running a Collector Locally and Testing Traces
You’ve got instrumentation. Now it’s time to capture those traces with an OpenTelemetry Collector and ship them to something visual like Jaeger.
We’ll use Vercel’s dev setup which comes pre-bundled with:
- OpenTelemetry Collector
- Jaeger
- Zipkin
- Prometheus
- Pre-wired Docker Compose config
1. Clone and Start the Collector Stack
The default config may be outdated. Replace otel-collector-config.yaml with the following updated version:
- Replaces deprecated exporters
- Adds support for latest collector version
- Sends traces to both Jaeger and Zipkin
You should see:
- OpenTelemetry Collector (ports 4317, 4318)
- Jaeger UI: http://localhost:16686
- Zipkin UI: http://localhost:9411
- Prometheus: http://localhost:9090
Add this to your .env.local:
Then restart:
You should see logs like:
Send a few requests:
Check collector logs:
Look for:
- Go to http://localhost:16686
- Select nextjs-observability-demo in the dropdown
- Click Find Traces
- Click any trace to view its full request flow
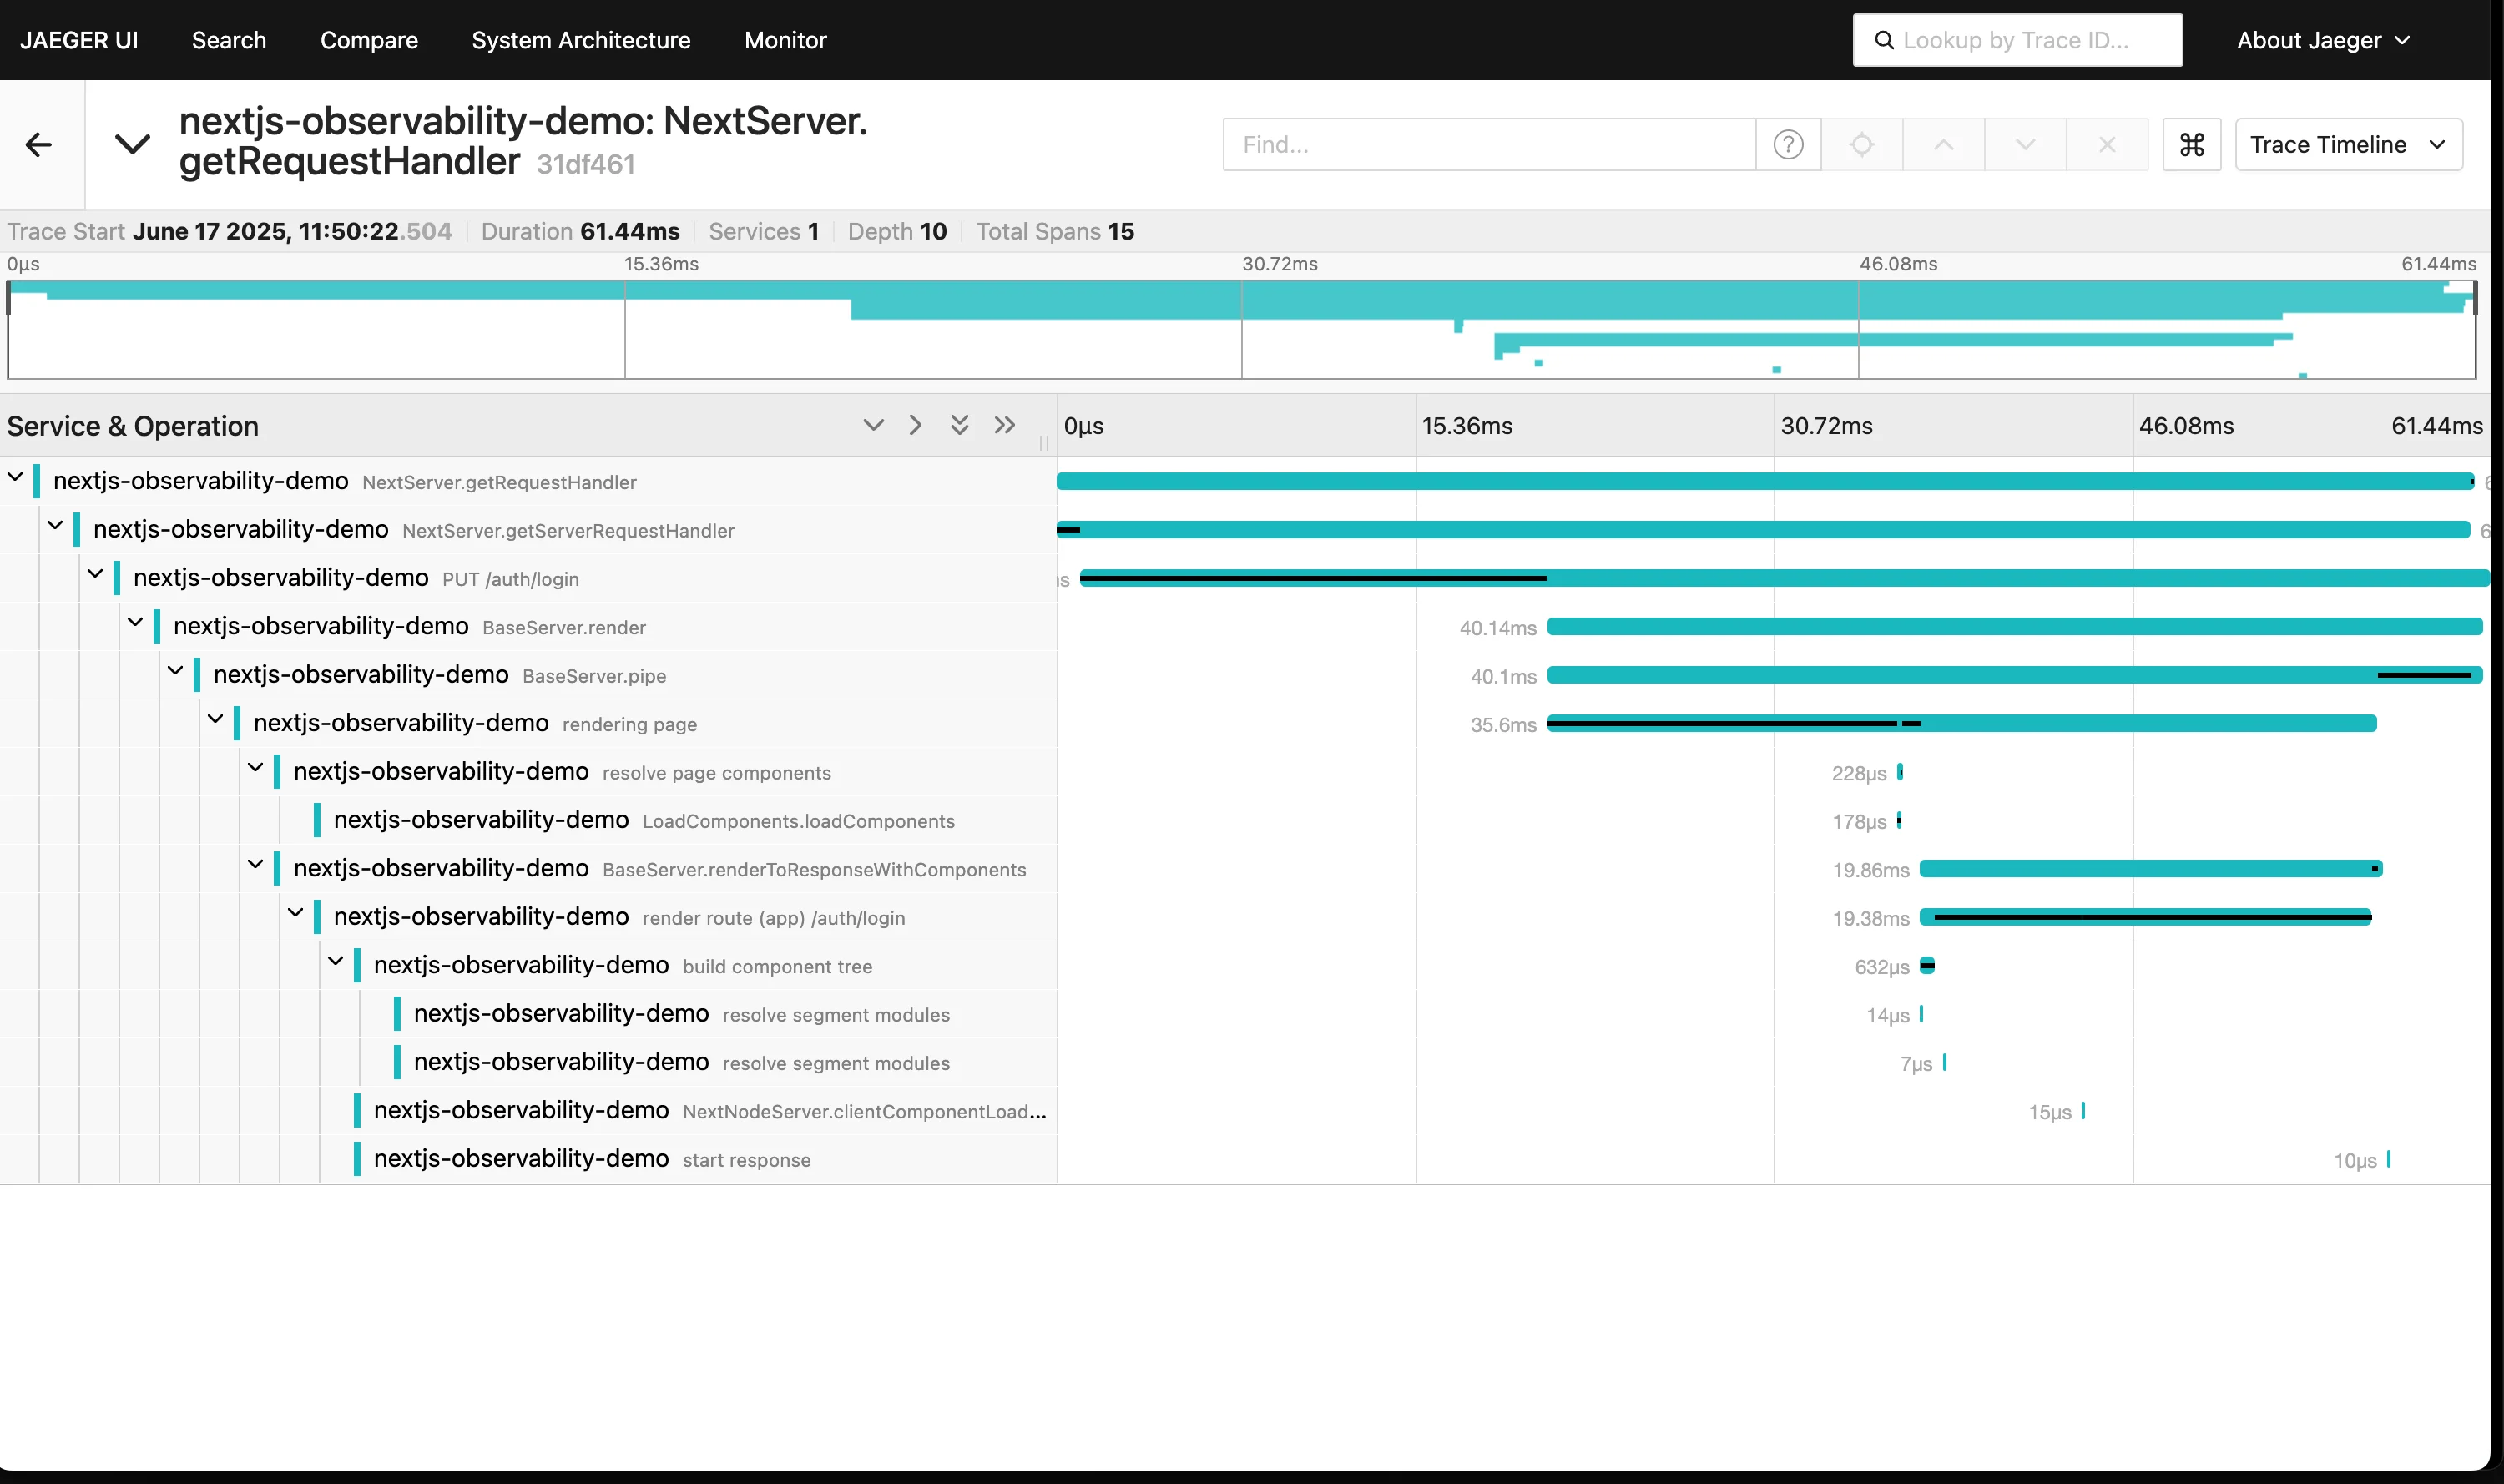 Example NextJS trace in Jaeger
| Collector keeps restarting | Bad YAML config | Run docker compose logs otel-collector and fix otel-collector-config.yaml |
| onError in Next.js console | Collector unreachable | Use 0.0.0.0:4318, not localhost:4318 in collector config |
| No traces in Jaeger | Missing env vars | Check .env.local for correct OTEL_EXPORTER_OTLP_... values |
| Docker doesn’t start | Docker Desktop not running | open -a Docker (macOS) or start it manually |
Now that traces are flowing and visualized, we’ll look at how to interpret them—what each span tells you, and how to drill into performance issues in your Next.js stack using real trace data.
- Trace comparison — spot regressions
- Dependency map — visualize service call flow
- Direct links — share traces with teammates
- Export support — for deeper analysis
Jaeger is great—until it isn’t.
| Visualize request flow | No dashboards |
| Drill into trace timings | No metrics or alerts |
| Debug route/API latency | No log correlation |
| Understand call dependencies | No business KPI visibility |
We need more than just a trace viewer. In production, you want:
- Metrics + alerting
- Logs + trace correlation
- Dashboards for teams
- Advanced filters and KPIs
Next up: how to plug SigNoz into your setup to get full-stack observability—without leaving OpenTelemetry.
Let’s go.
Jaeger is great for local debugging—but when you move to production, you need more: metrics, logs, alerting, dashboards. That’s where SigNoz comes in.
| Distributed tracing | ✅ | ✅ |
| Metrics dashboard | ❌ | ✅ |
| Log aggregation + correlation | ❌ | ✅ |
| Real-time alerting | ❌ | ✅ |
| Long-term storage | ❌ | ✅ |
| Custom dashboards / KPIs | ❌ | ✅ |
You get everything Jaeger does, plus actual production monitoring.
Let's update the existing otel-collector setup to export traces and metrics to SigNoz Cloud - while keeping Jaeger for local use.
Update your .env file in opentelemetry-collector-dev-setup:
Note: Create an account on SigNoz Cloud and get the ingestion key and region from the settings page.
Add SigNoz to the list of exporters:
Pass SigNoz credentials as environment vars:
Check logs to verify export:
You should see:
- Head to your SigNoz dashboard
- Check Services – you should see nextjs-observability-demo
- Go to Traces and Select one to visualize it
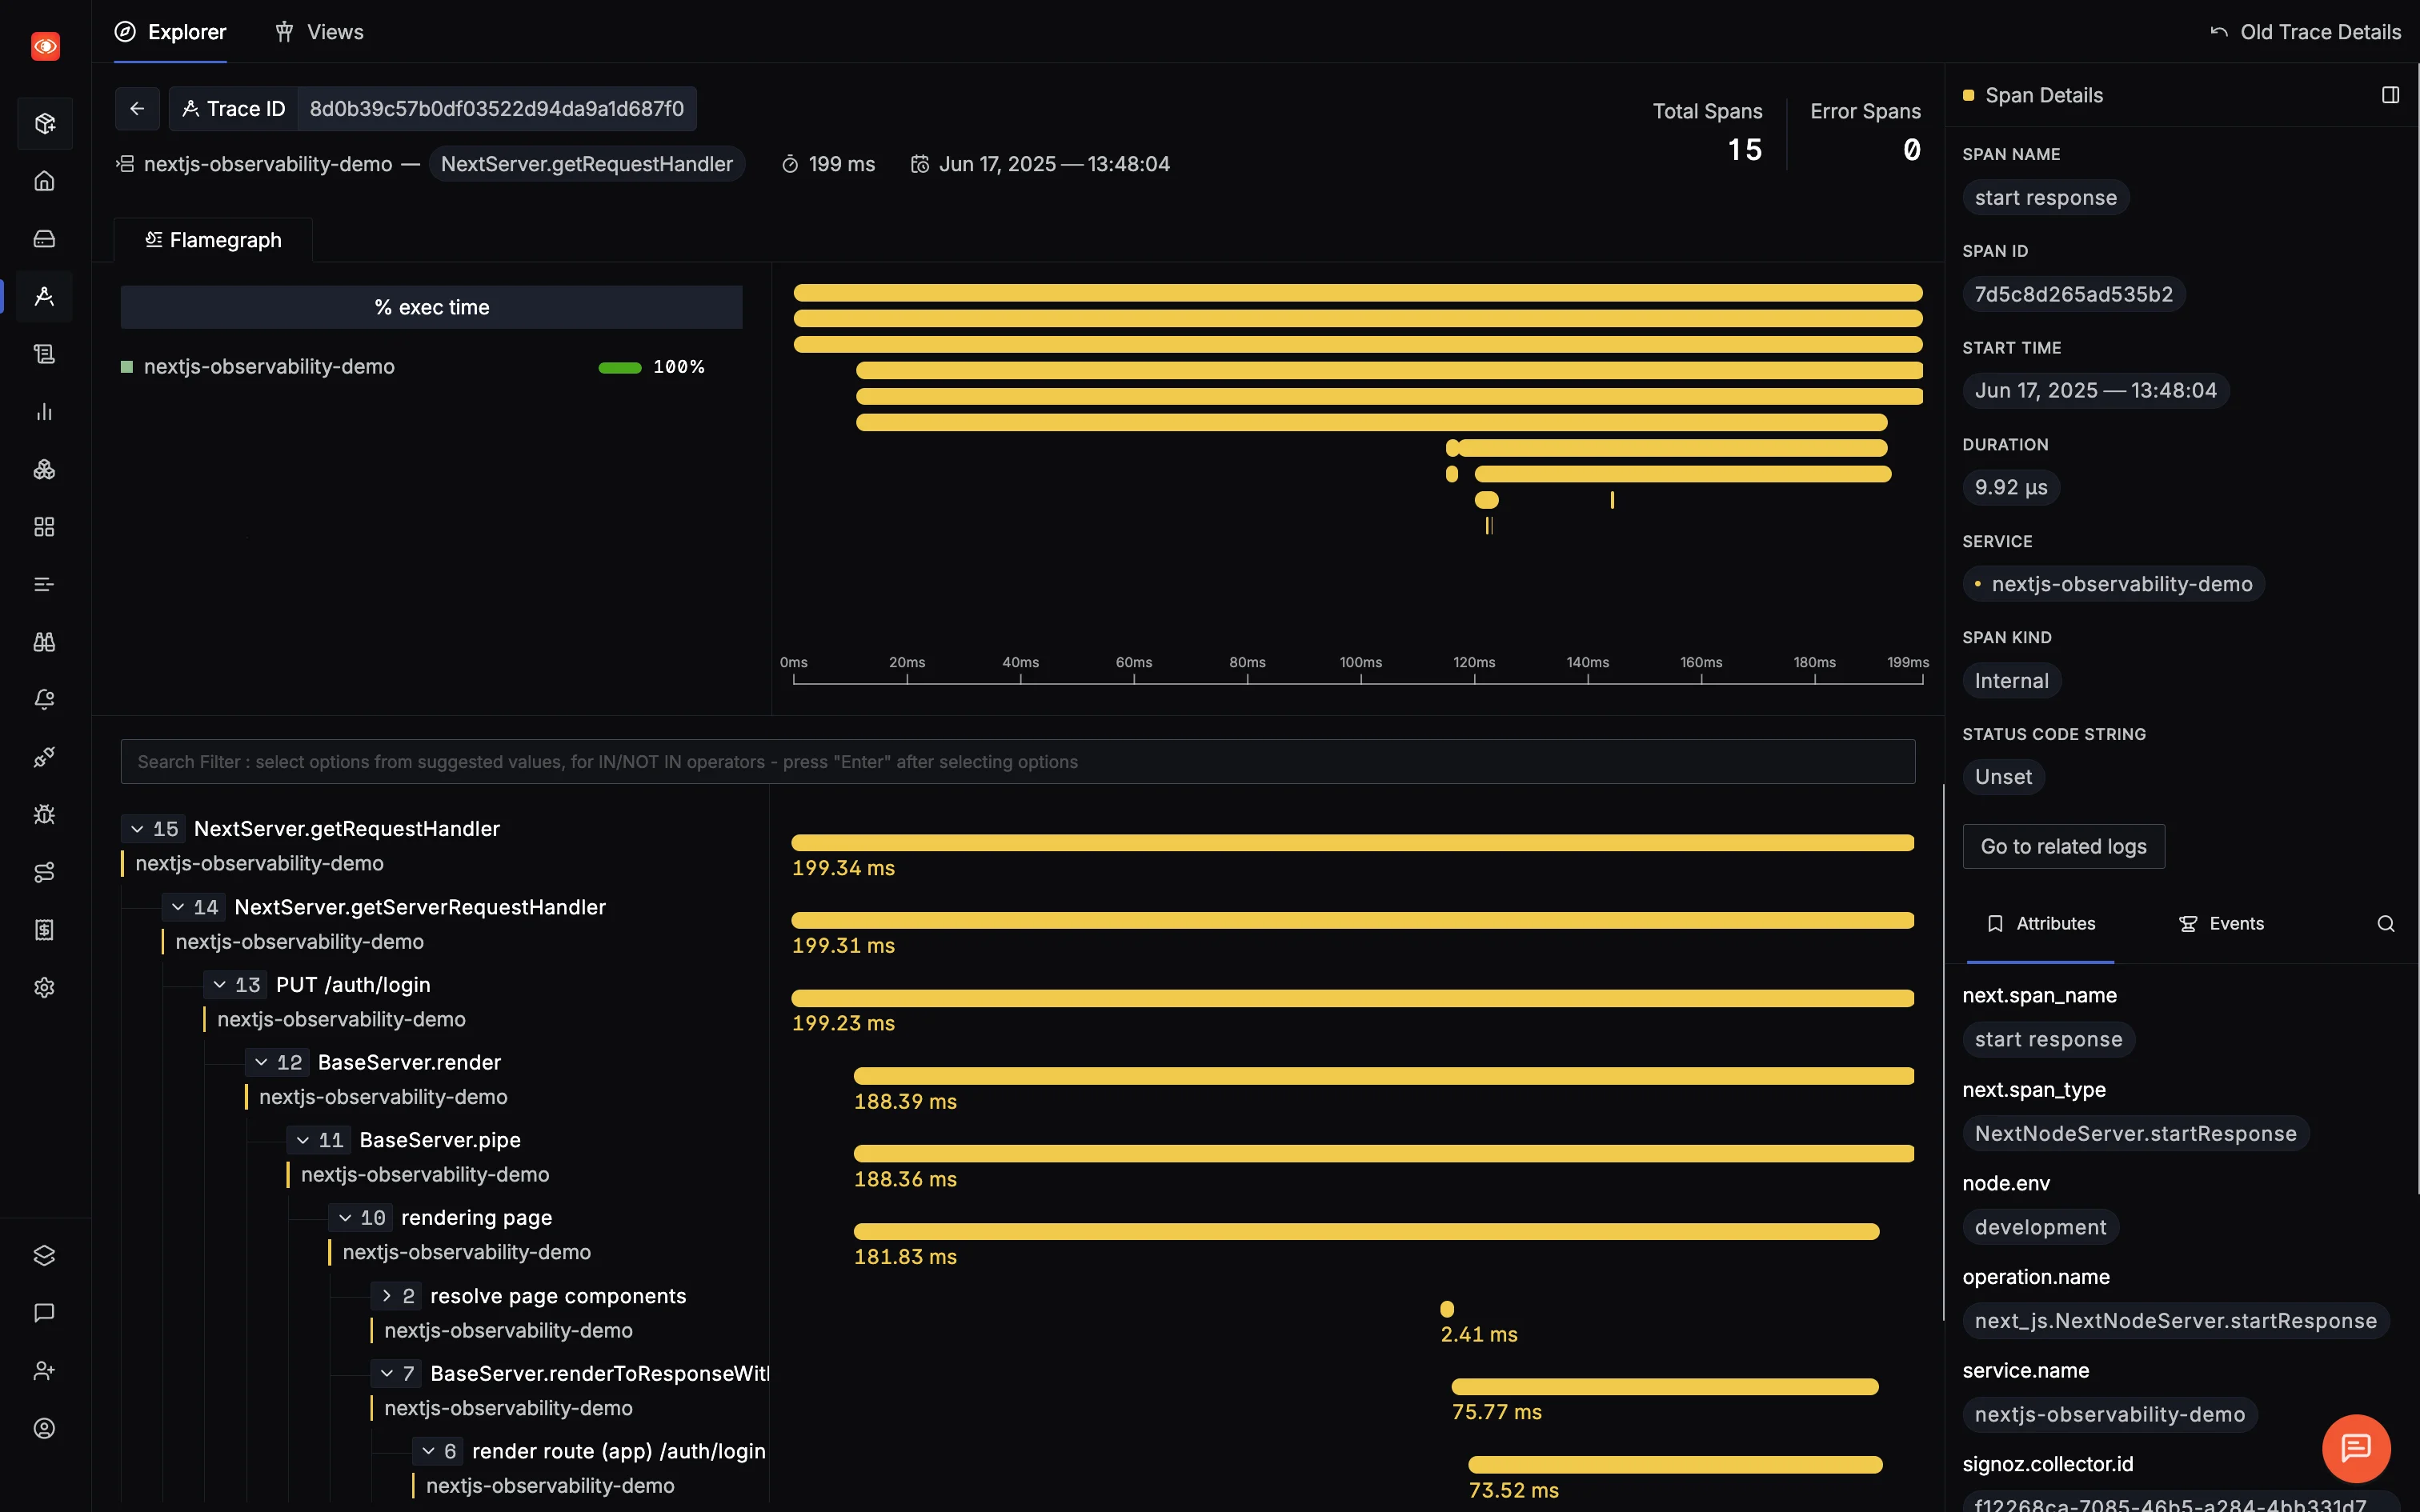 SigNoz Trace Details Page with Support for over a million span.
You can send traces directly from the app (skip collector), but it’s not ideal for production:
- Works with multiple backends (SigNoz + Jaeger)
- Better reliability and batching
- Local debugging + remote monitoring
| ❌ No data in SigNoz | Check collector logs for trace export failures |
| ❌ Wrong region | Update SIGNOZ_ENDPOINT to match your region |
| ❌ No environment variables | Verify .env is loaded correctly |
| ❌ Missing ingestion key | Copy it from SigNoz Cloud settings |
Now that your Next.js app is streaming traces to SigNoz, you’ll notice something right away: this isn’t just a Jaeger clone with better UI.
SigNoz ships with full-blown APM (Application Performance Monitoring) capabilities out of the box - without you having to write a single custom metric.
That means no YAML spelunking, no manual dashboard setups—just useful insights, right there, from the moment traces start flowing.
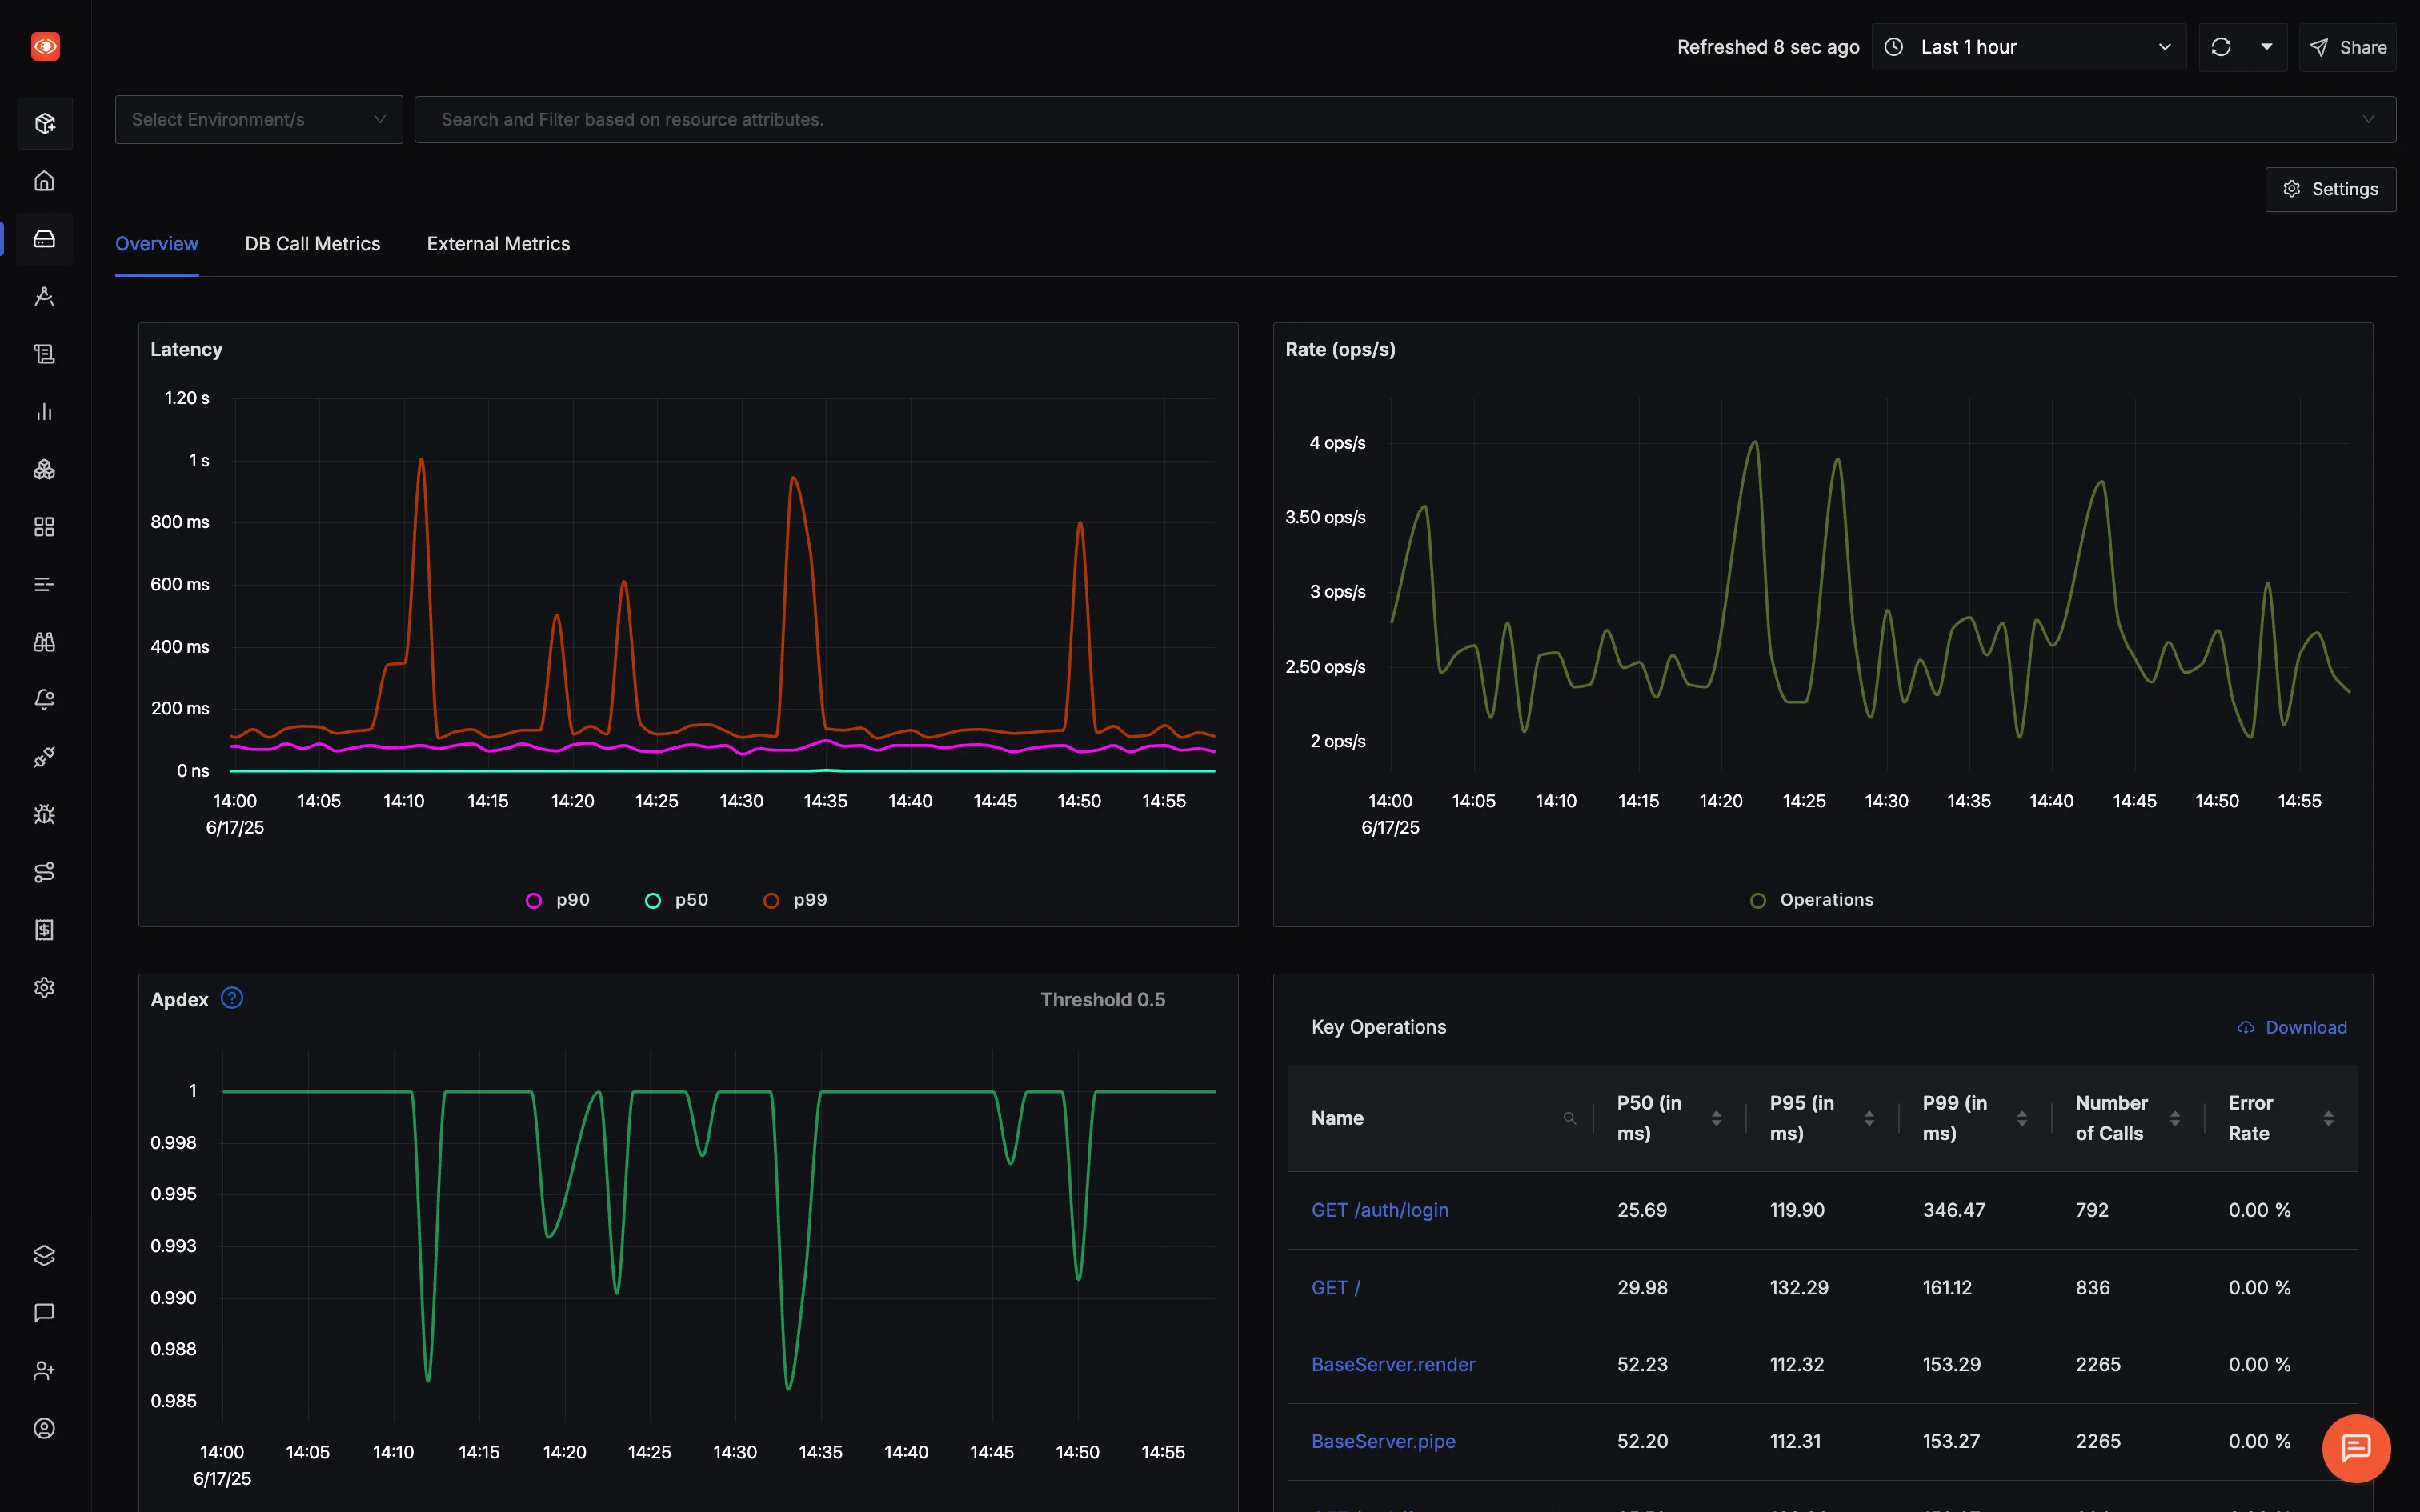 SigNoz out of the box APM
Most APMs either overload you with graphs or bury useful data behind paywalls. SigNoz hits the sweet spot: high-fidelity insights derived directly from OpenTelemetry traces, backed by high performing columnar database for blazing-fast queries and dashboards that update in near real-time.
You get:
- Latency breakdowns (P50, P90, P99)
- Request rate, error rate, Apdex
- Database and external API performance
- Auto-discovered endpoints
No extra config. No magic wrappers. Just signal.
Let’s say you see a latency spike around 2:45 PM. Instead of guessing, you:
- Click the spike on the chart
- SigNoz filters down to relevant traces
- You spot a rogue DB query eating 2.1 seconds
No guesswork. No slow log tailing. Just trace → span → fix.
If your app calls Supabase, Stripe, or any third-party API, you’ll see how long those calls take, how often they fail, and where they sit in your request timeline.
Same goes for your database queries: SigNoz shows frequency, duration, and highlights outliers as slow queries—without needing a separate DB monitoring solution.
In the upcoming articles, we'll explore how to actually use SigNoz to:
- Find slow endpoints
- Track API performance
- Alert on spikes or failures
- Create dashboards for your team
Let’s observe!