.png)

Recent commentaries of a "free fall" in trans identification are limited by biased survey questions and questionable weights
Strong conclusions of a “free fall” in transgender identification among U.S. youth may have been greatly exaggerated. SEGM’s analysis of a large sample of U.S. college students over time suggests that trans/nonbinary identification is at an all-time high as of spring 2025—ranging from 4.7%-6.7% (the margin of error is about 0.2%). However, there is tentative evidence of a plateau—driven primarily by a flattening of the rate of “nonbinary” identification. Cross-sex identification, which is much rarer than nonbinary identification, appears to still be on the rise, especially among females who identify as "trans men."
Our finding that the incidence of trans/nonbinary identification among college youth may be plateauing—but not sharply declining as previously reported—might not generalize to non-college youth. This warrants further analysis comparing both groups. At the same time, we show that the recent reports of a sharp decline in transgender/nonbinary identification may be unreliable due to problematic question wordings and reliance on statistical weights applied to a very small population.
We present our analysis below. In the SEGM takeaway, we reflect on the difficulties in quantifying the prevalence of transgender identification using survey data, and on the strengths and limitations of relying on non-peer-reviewed sources to discuss important public health trends.
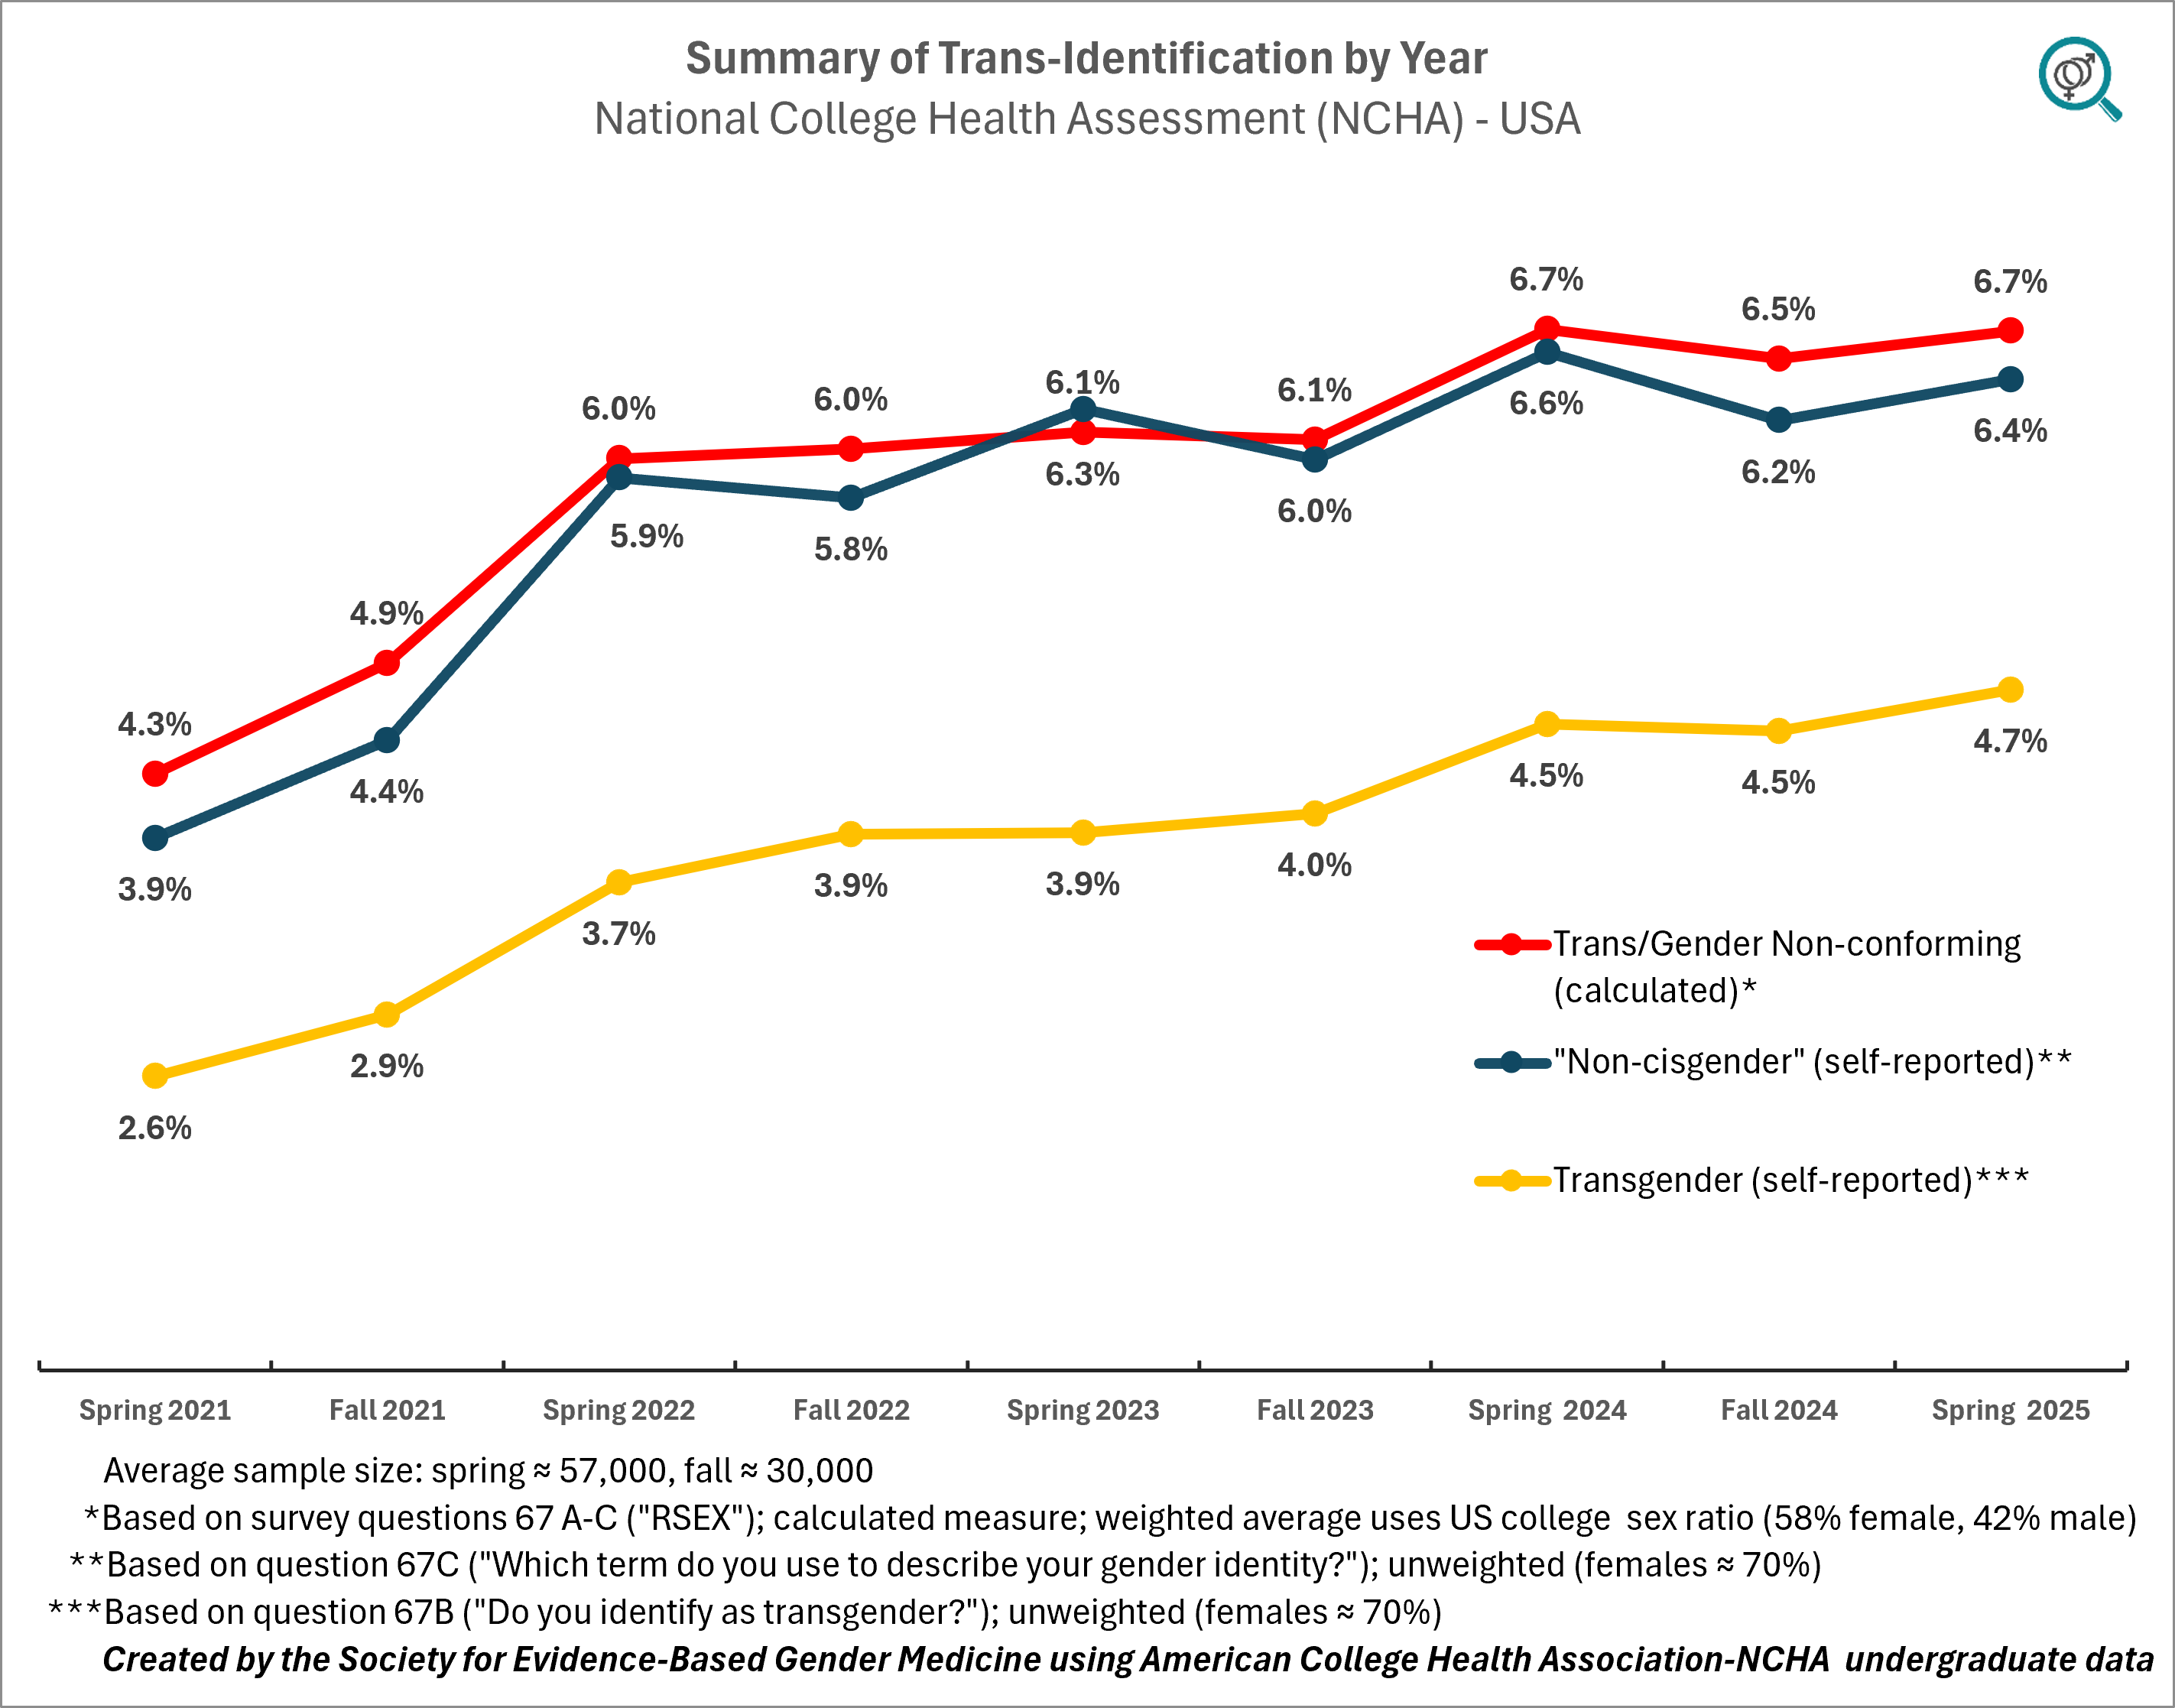
1. The proportion of U.S. college students identifying as transgender continues to increase
According to the data published by the American College Health Association's National College Health Assessment, the proportion of students self-reporting a “transgender” identity has risen steadily, reaching 4.7% (almost 1 in 20) as of spring 2025 (see Figure 1).
Figure 1
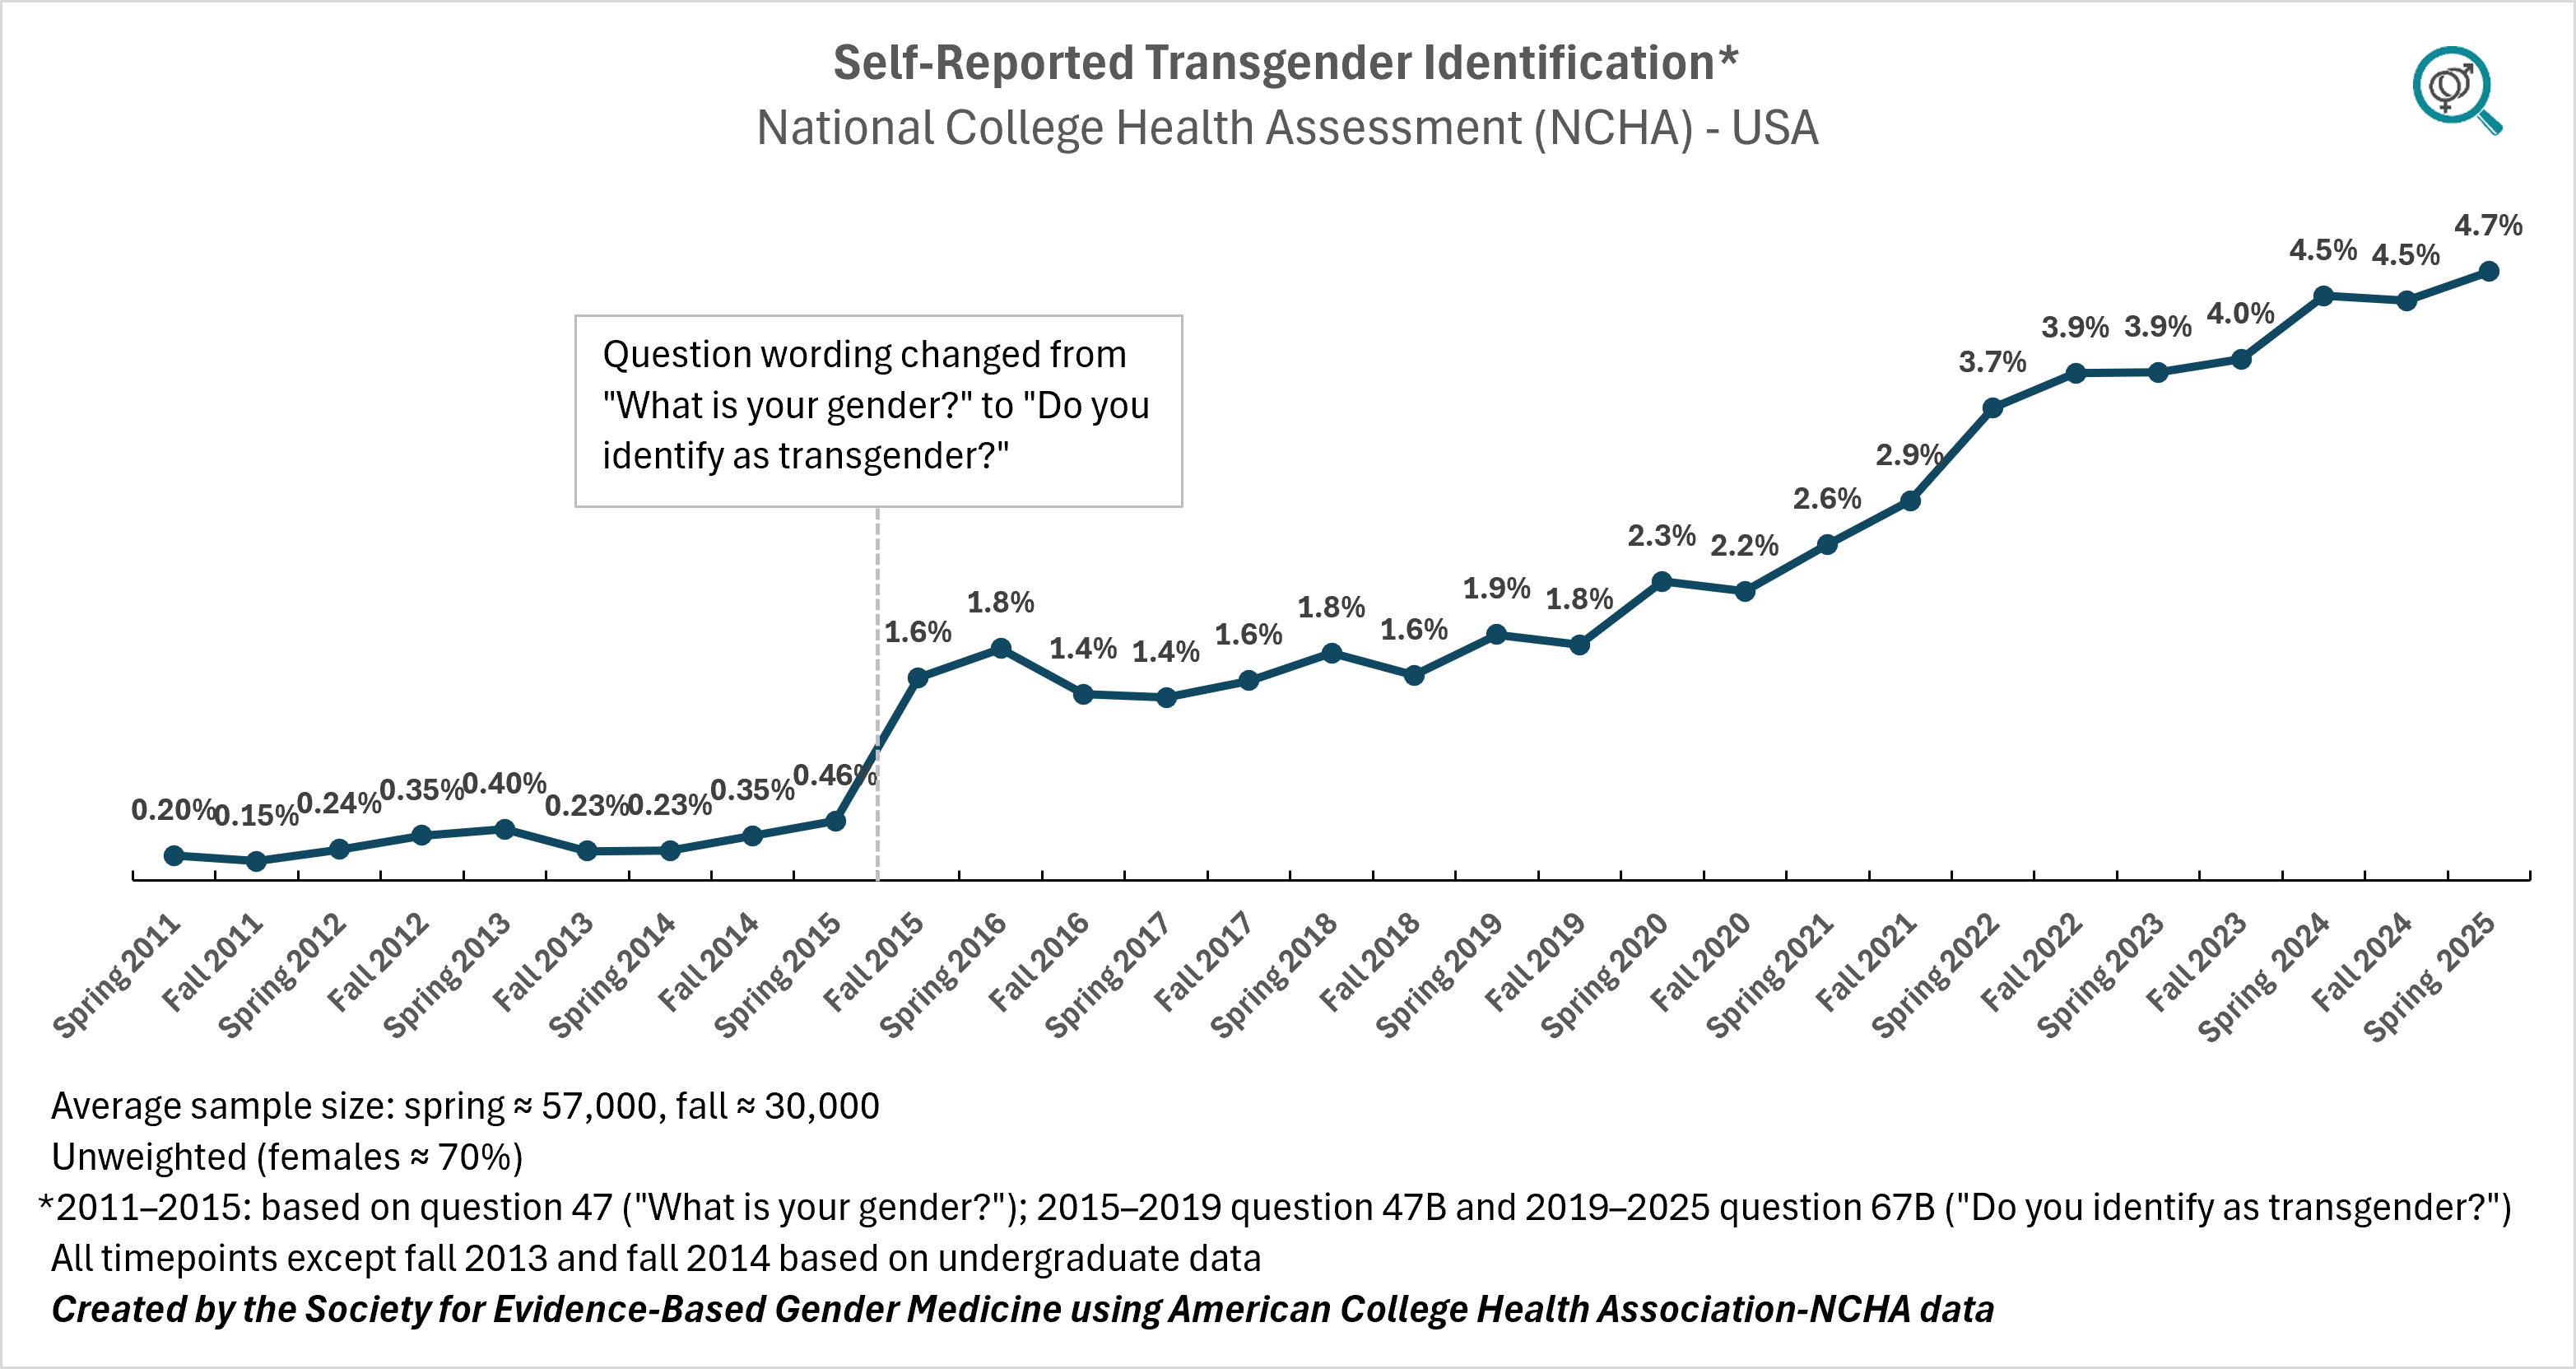
The American College Health Association's National College Health Assessment (ACHA-NCHA) has surveyed 2.5 million students at more than 1,000 higher-education institutions over the last 25 years. The survey is done every spring and fall, with the spring wave averaging 57,000 respondents and the fall wave averaging 30,000 respondents. The respondents' average age is 20, and 70% of respondents are female.
ACHA-NCHA has asked students about transgender identification since its inception in 2000, when it reported a prevalence of 0.1%. Until spring 2015, “transgendered” was one of the possible answers to the question “What is your gender?” Starting in fall 2015, the question wording changed to “Do you identify as transgender?”
This finding has limitations, largely stemming from the methodology for this sample (not all college campuses participated, and students could self-select). One of the most obvious limitations is that female students were more likely to participate than the male students. And, since women were also more likely to report a transgender identity (see Figure 4 below), the overall rate of trans identification is overestimated. However, the female response bias is consistent across years and does not distort the trend, which continues to climb.
2. The number of students who identify as “nonbinary/other” is much greater than those who identify as “trans man” or “trans woman”
Another ACHA-NCHA survey question asked participants, “Which term do you use to describe your gender identity?” Alongside “woman or female” and “man or male,” students could also select "trans man," "trans woman," or nonbinary-type identities such as "non-binary," "genderqueer," "genderfluid," and "agender." As the data below demonstrate, students with nonbinary-type transgender identities far outnumber those with “binary” transgender identities. As of 2025, this identity is hovering at levels that are nearly four times higher than a decade ago. At the same time, the "nonbinary-type" trans identification appears to have plateaued since approximately 2022 (see Figure 2).
Figure 2
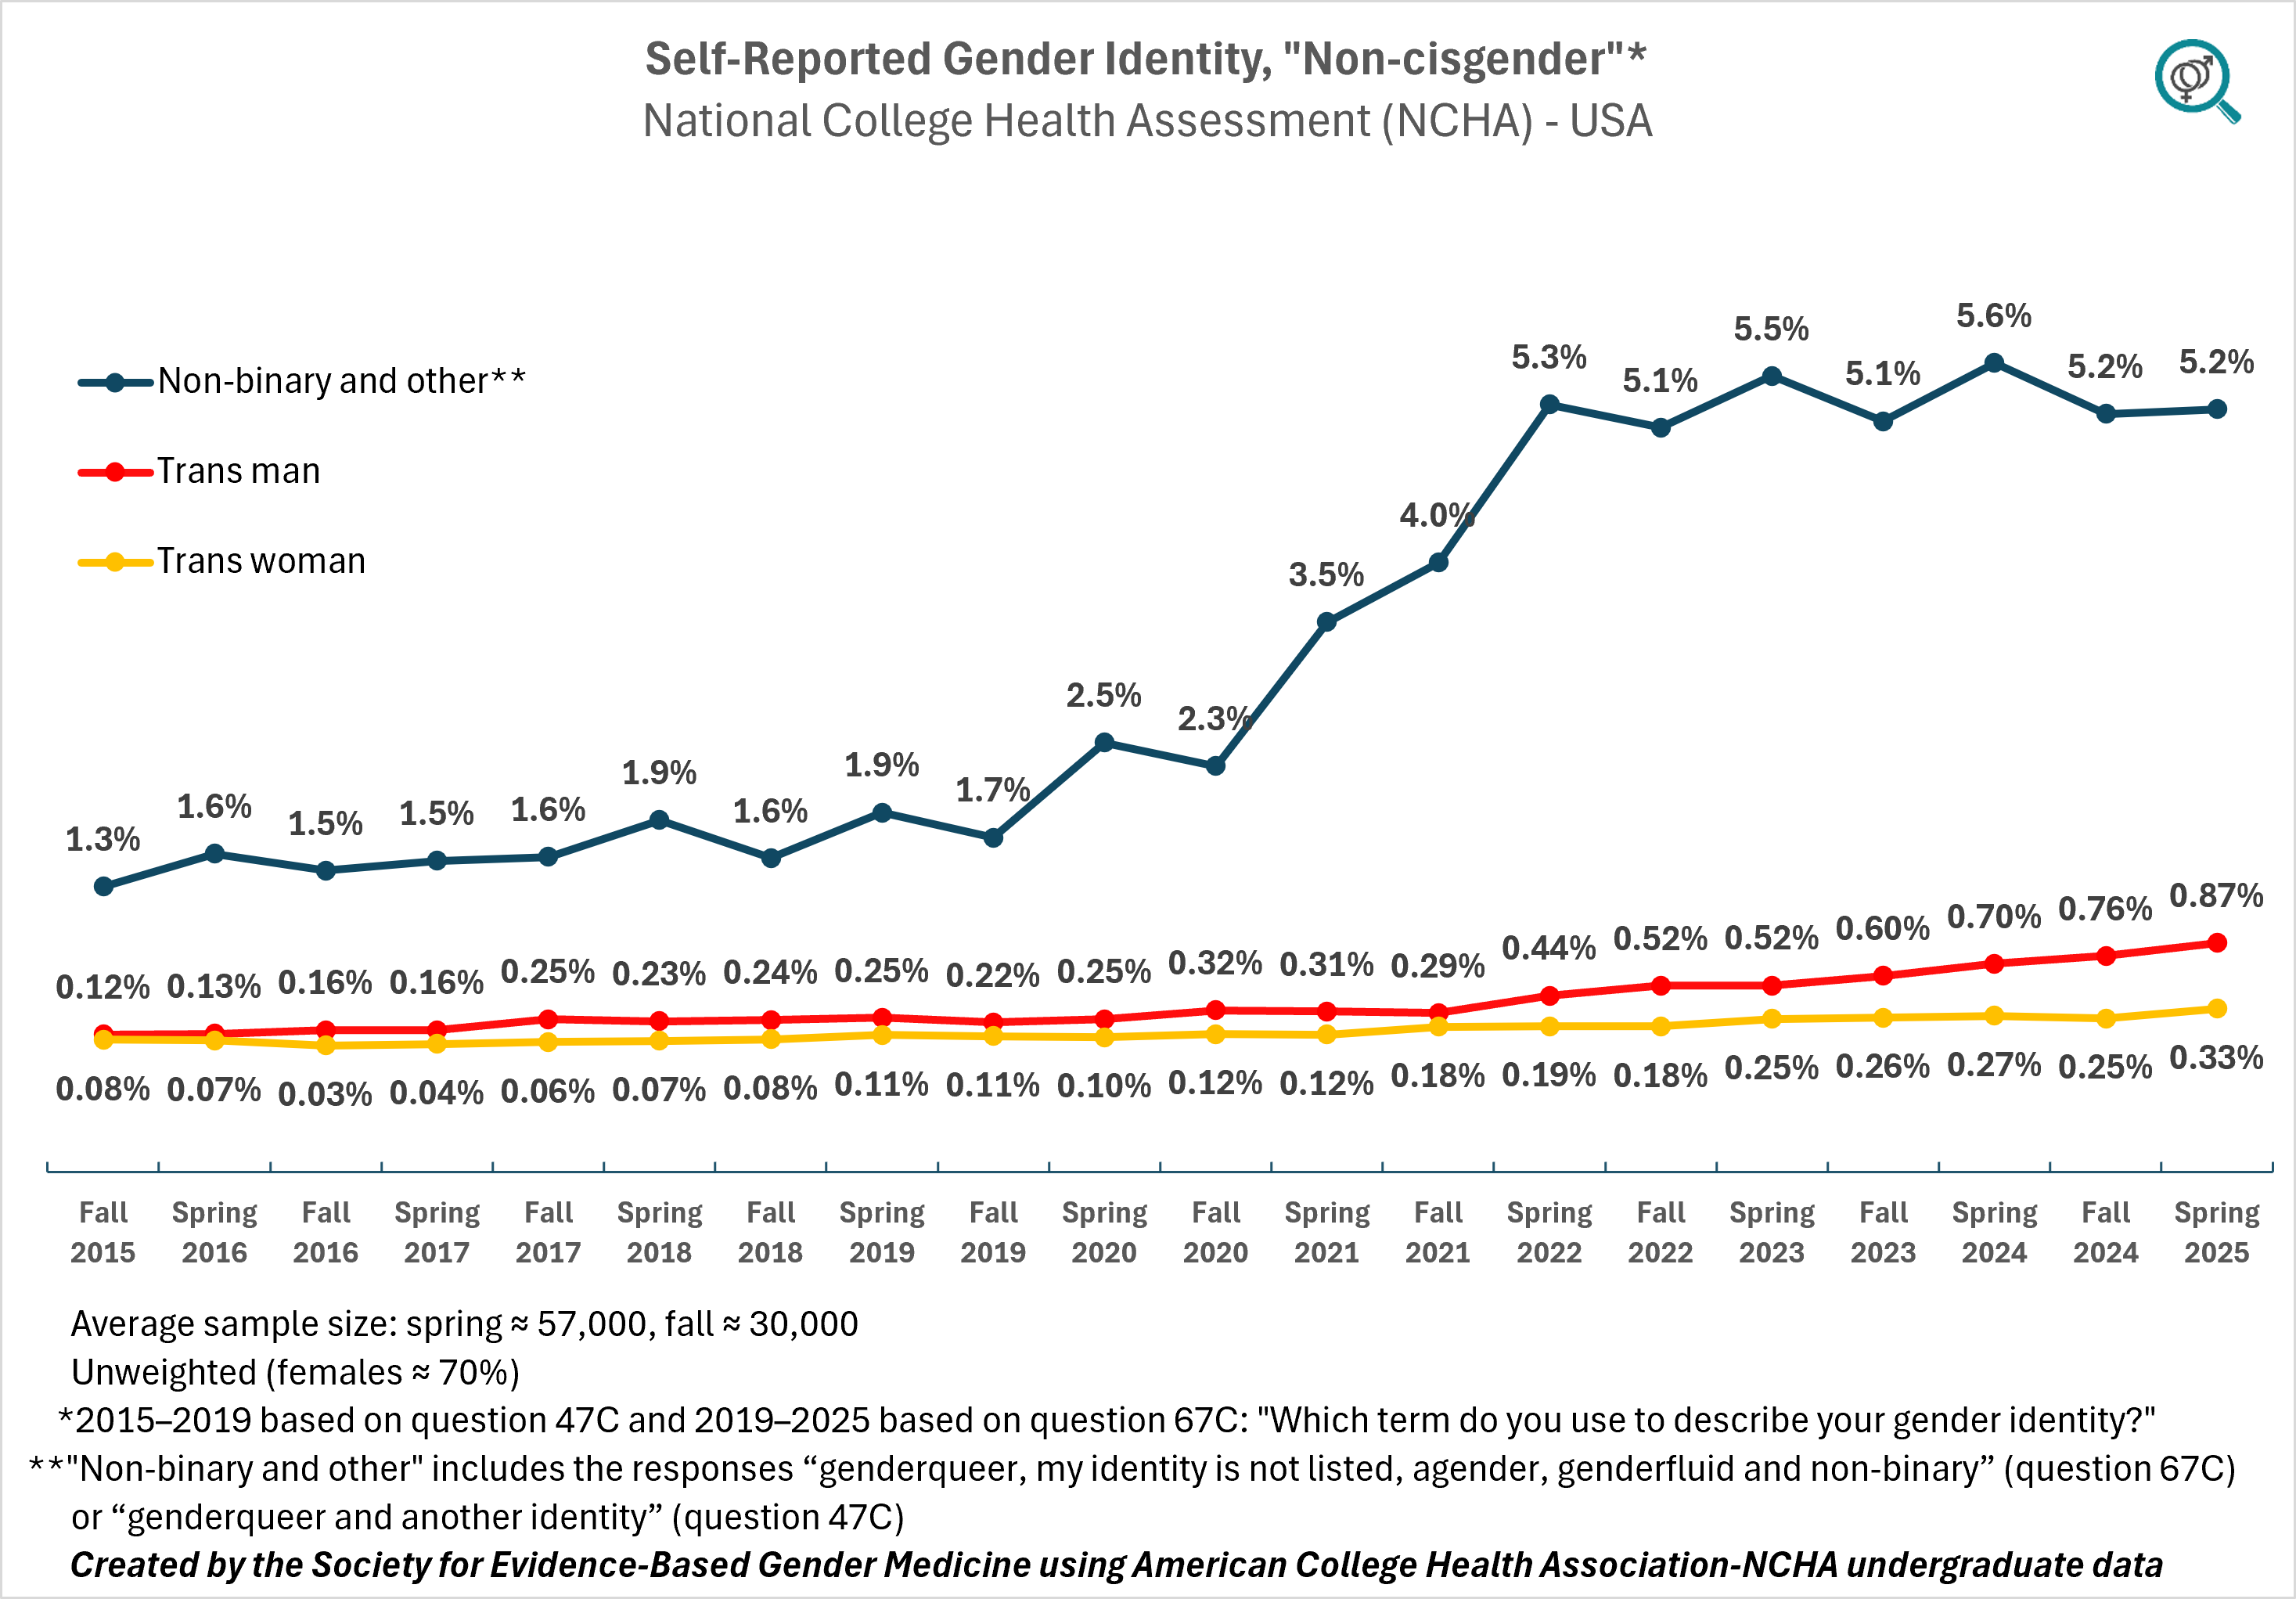
While the rate of “nonbinary” trans identification has stopped growing since 2022, the rate of students who identify as "trans men" has continued to increase, and there is also evidence of a continued but smaller increase in the number of students who identify as “trans women" (see Figure 3).
Figure 3
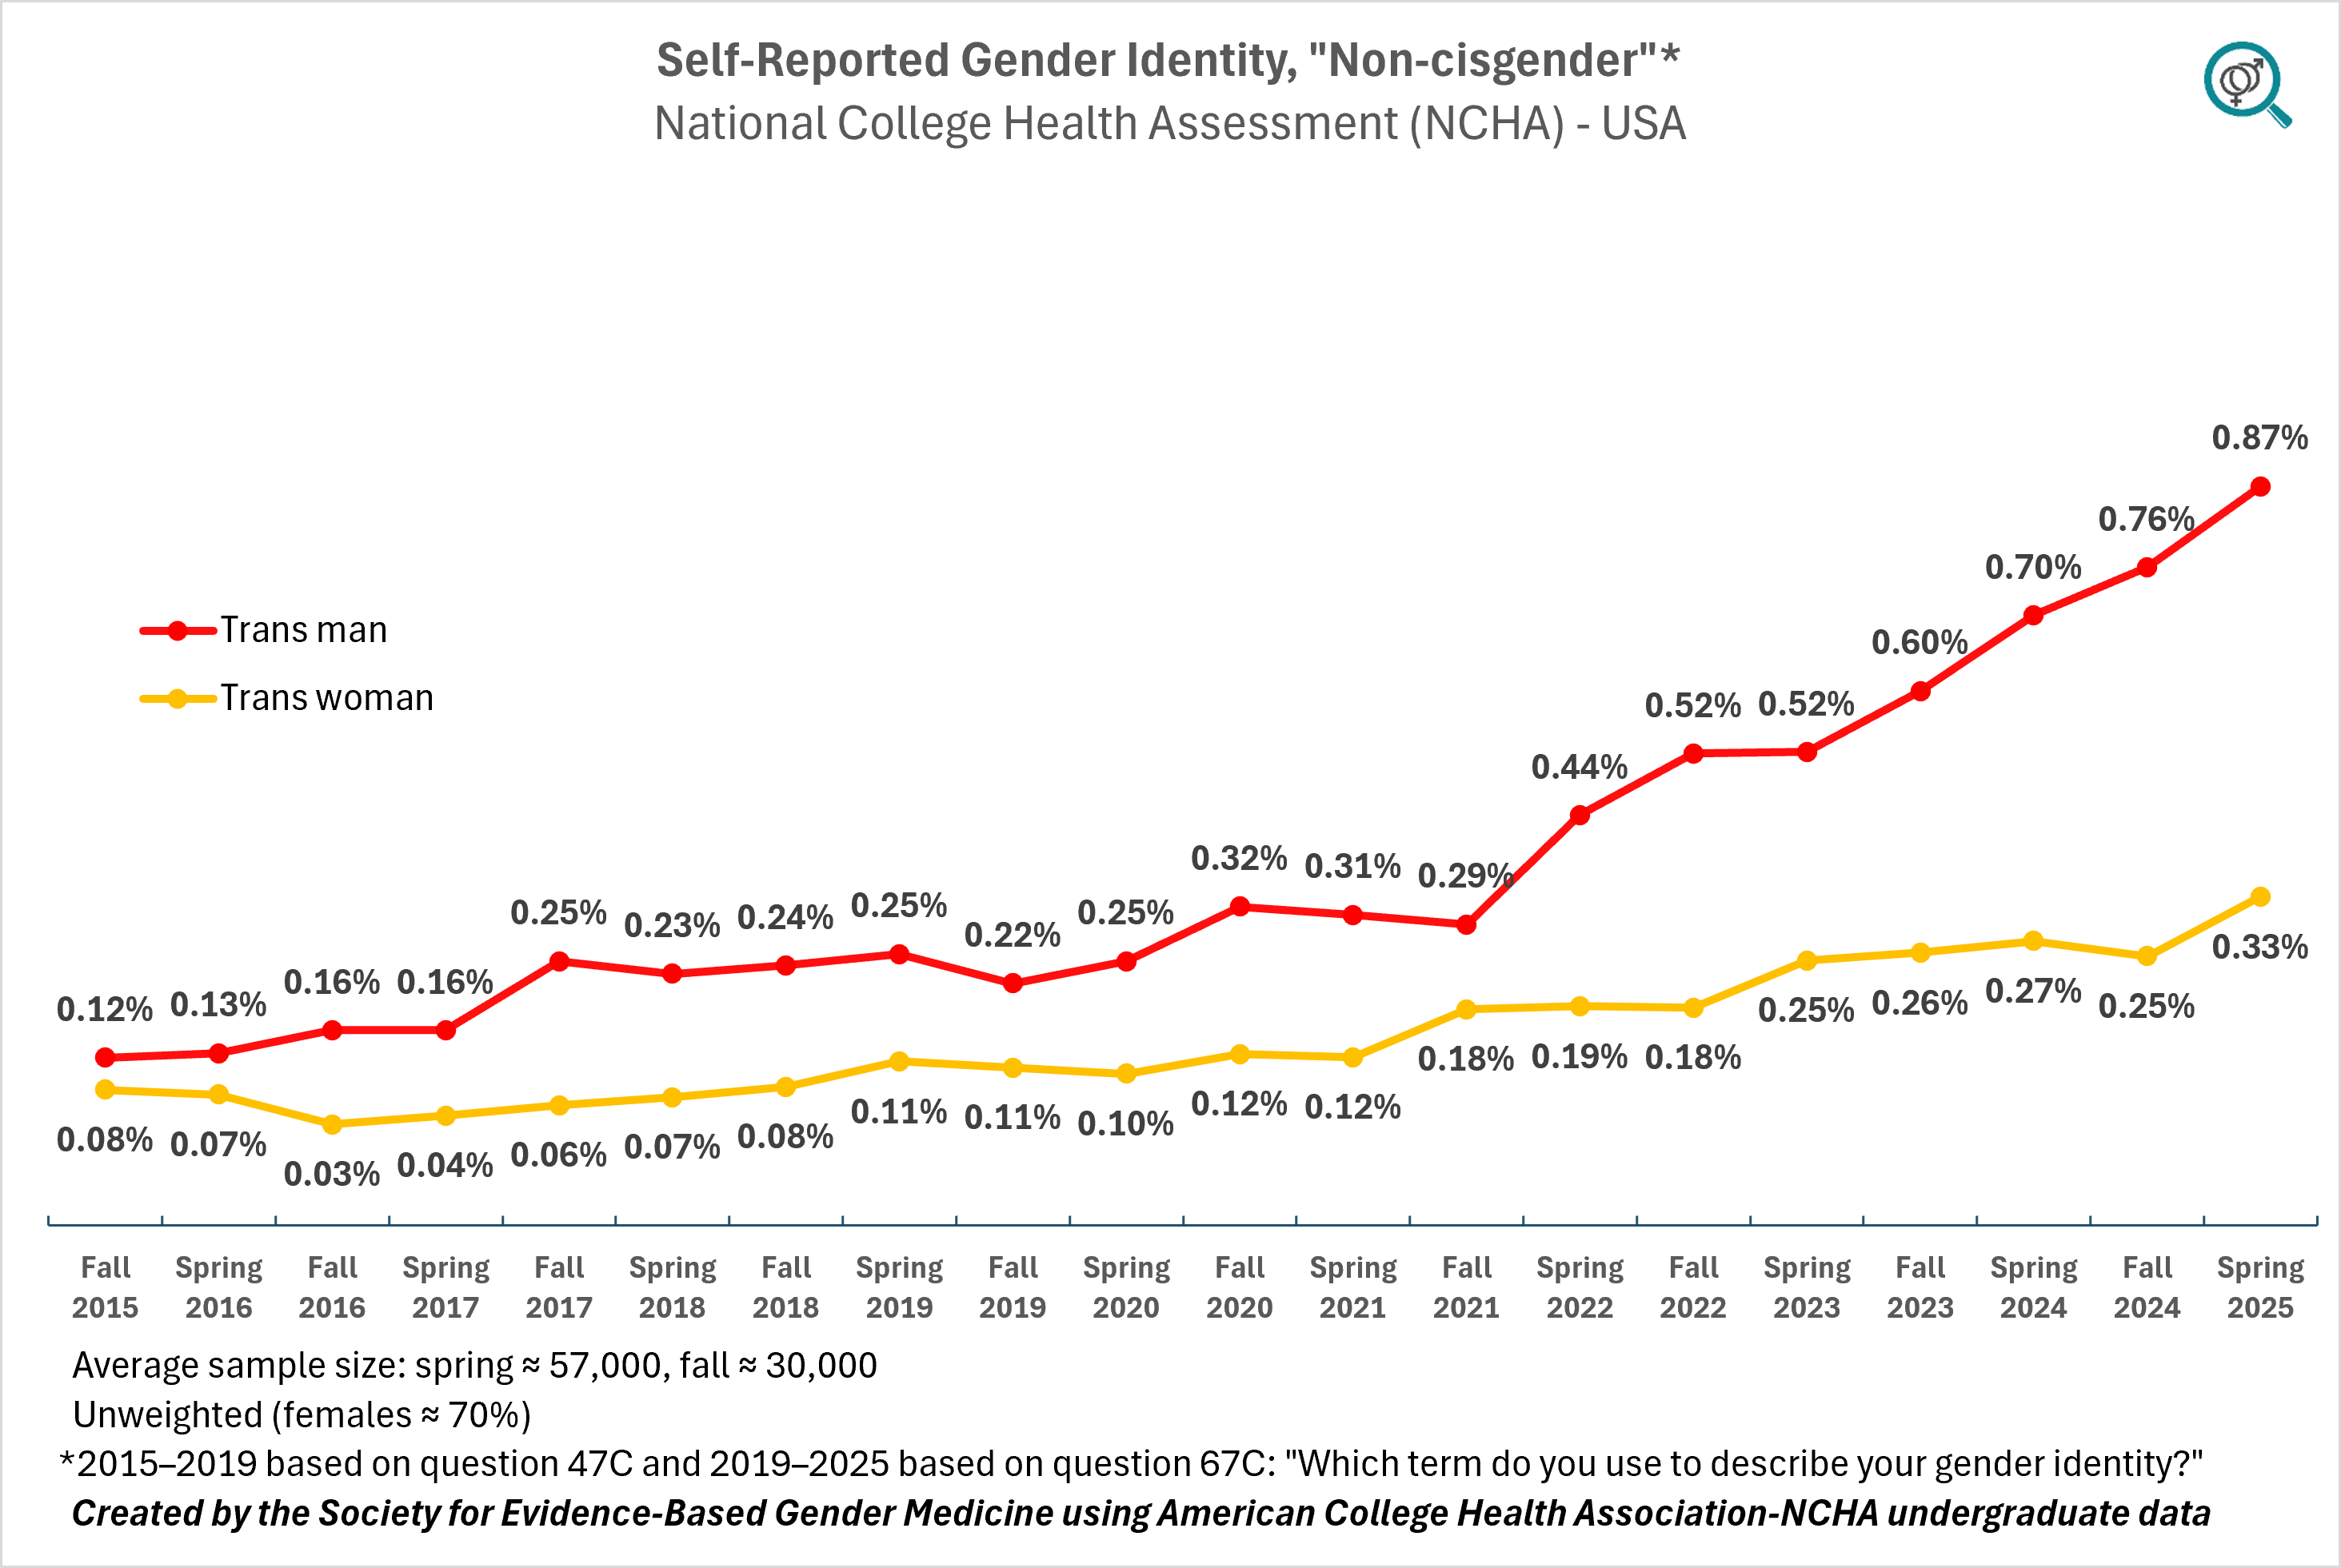
Several points are worth noting about the data above. The proportion of respondents identifying as binary transgender—specifically, as trans men (0.87%) or trans women (0.33%)—is markedly lower than the 2.8% “transgender identity” rate reported by the CDC for a comparable age group (18–24-year-olds). This discrepancy suggests that “nonbinary-type” transgender identities account for most of the overall “transgender” category in population statistics.
However, another factor may contribute to the lower observed rate of binary transgender identification: some youth who identify as “binary” transgender may select “man” or “woman” rather than “trans man” or “trans woman” on surveys. This tendency would lead to an undercount of cross-sex-identified individuals in self-reported data.
Finally, the rate of nonbinary identification in this sample is likely somewhat overstated. As discussed earlier, females are overrepresented in the dataset, and females are statistically more likely to identify as "gender non-conforming," corresponding to the "nonbinary-type" identification in this sample. This imbalance in the survey likely inflates the overall prevalence of nonbinary identity in the sample.
The next section corrects for the female overrepresentation by applying statistical weights by sex.
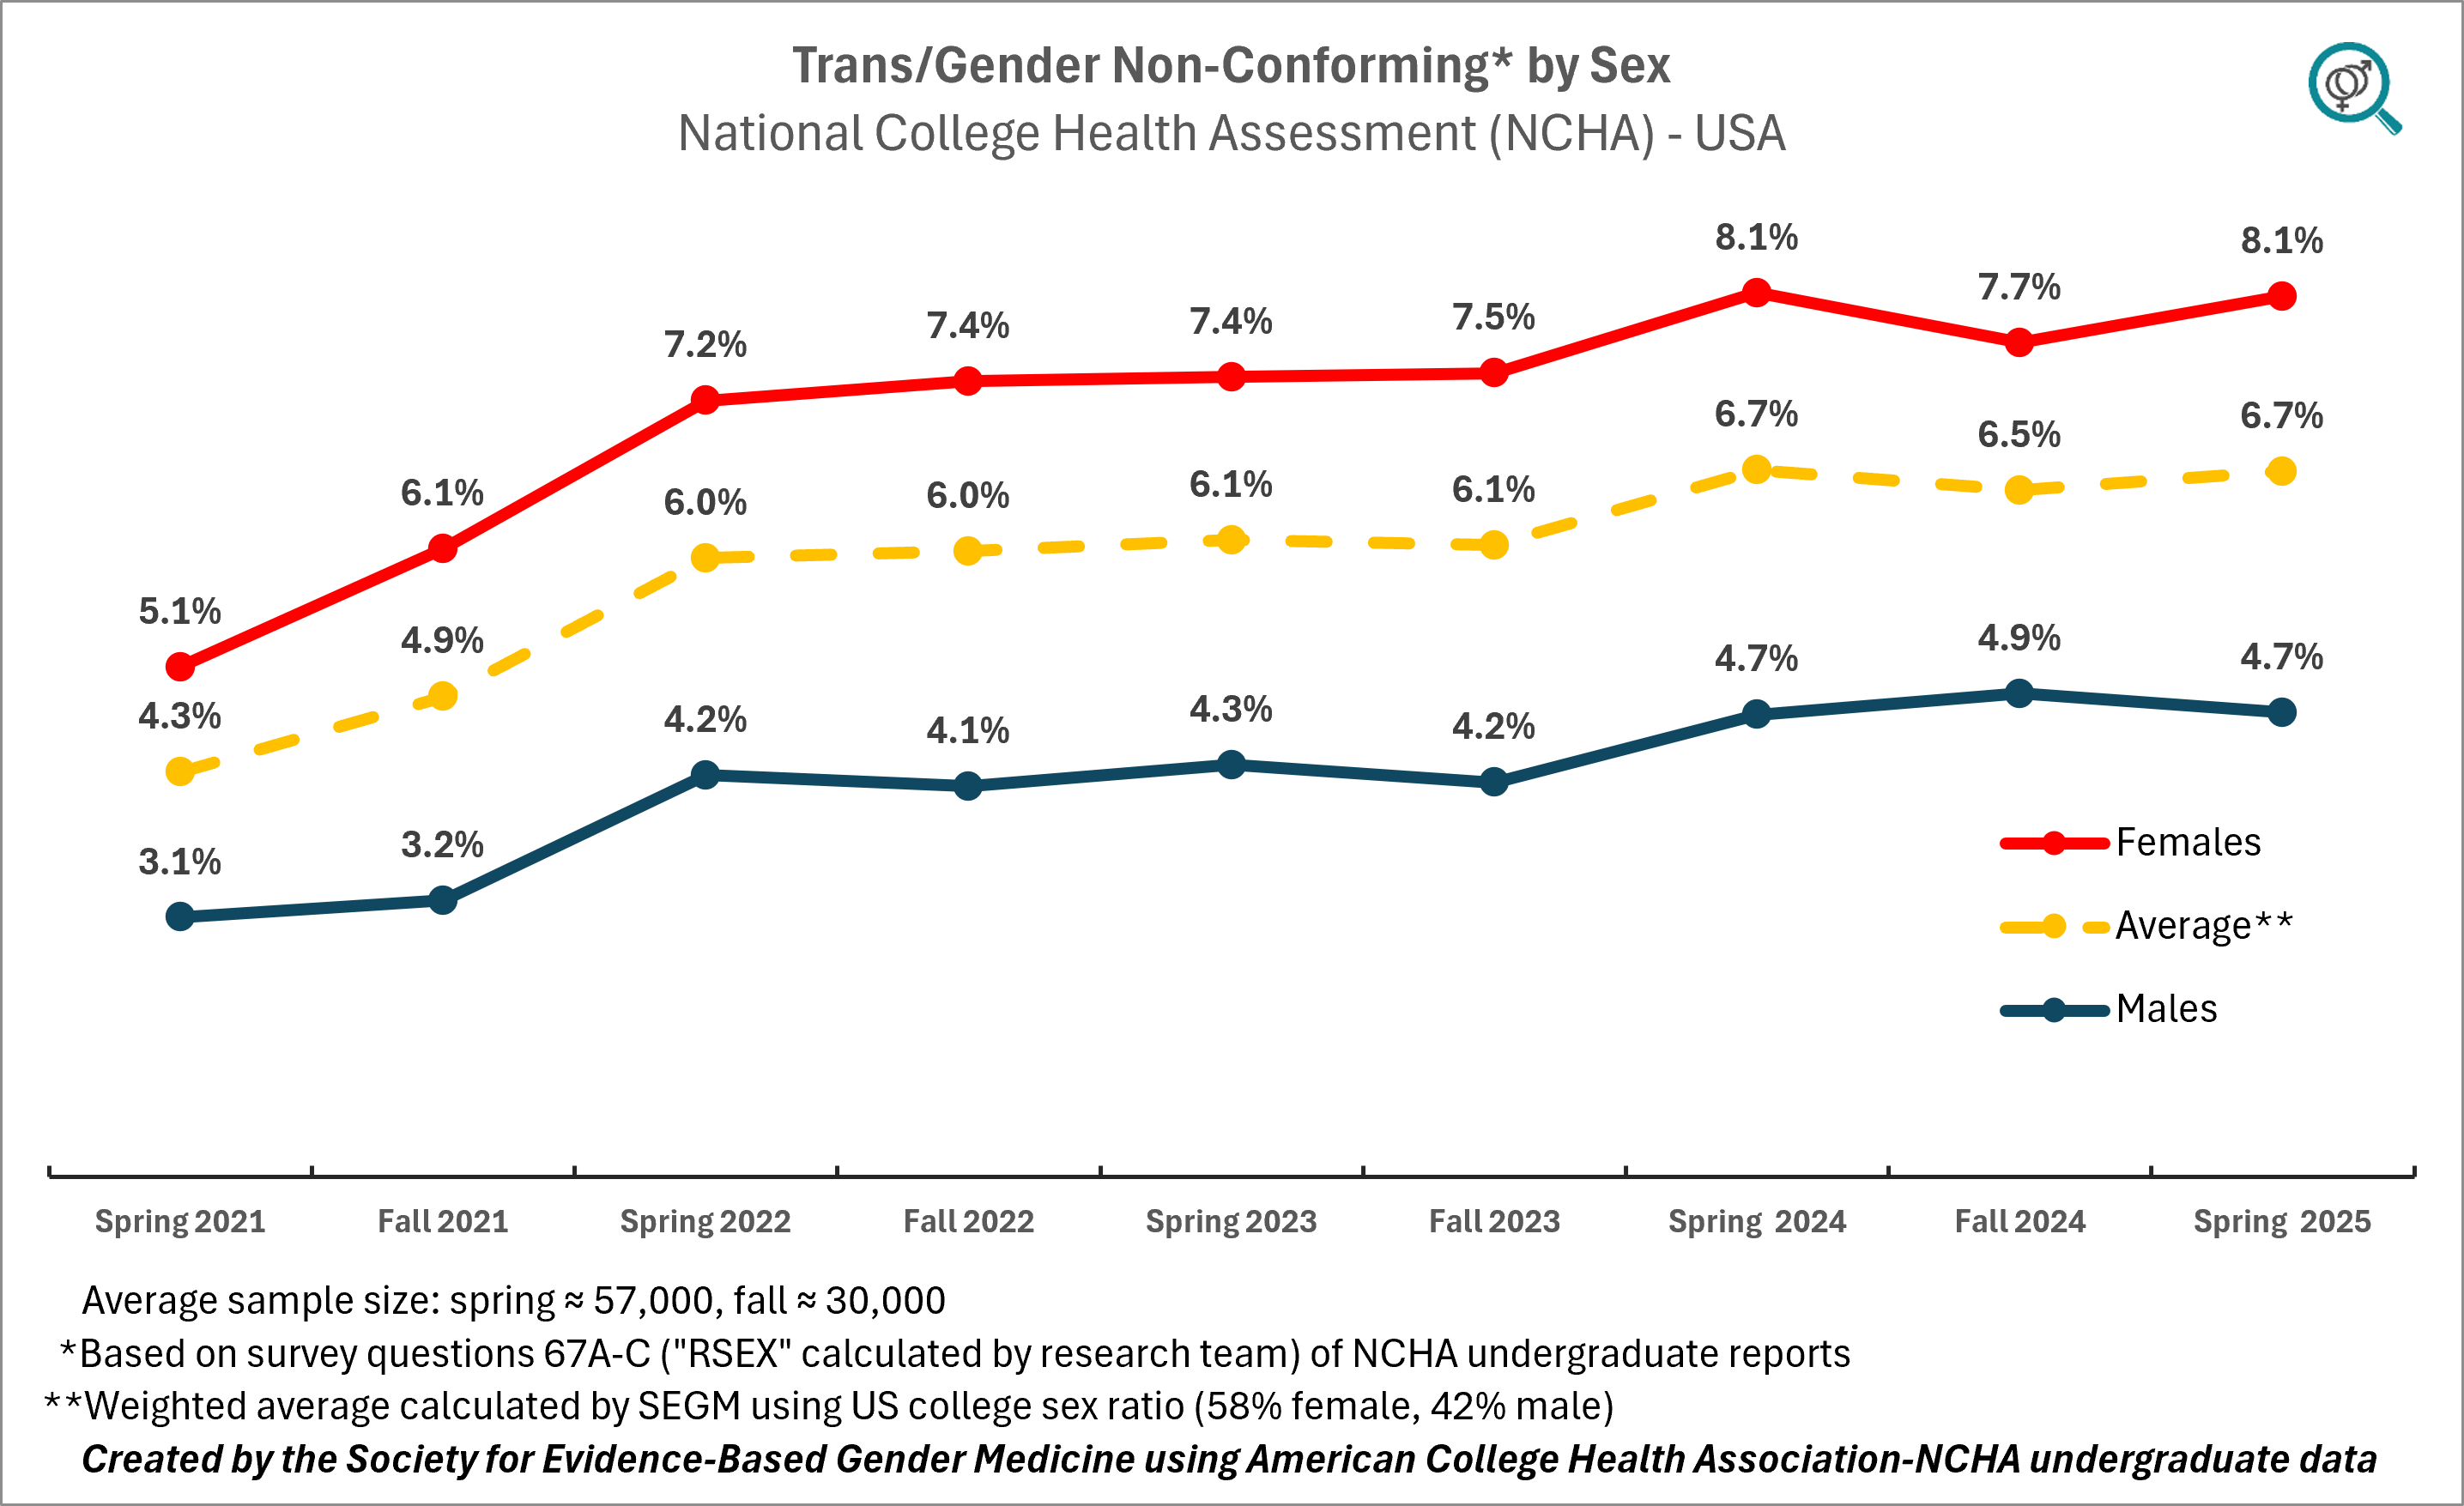
3. Females are more likely than males to report an identity inconsistent with their sex
The data suggest that over 8% of females and just under 5% of males do not identify with their sex, which has been categorized by the ACHA-NCHA as a “non-cisgender” identity. It is important to understand the methodology behind these numbers to interpret these findings.
Starting in spring 2021, the ACHA-NCHA amended its prior approach to quantifying transgender identities (see the spring 2021 ACHA report, p.3, "RSEX"). Rather than relying exclusively on identity-related self-reports, the researchers themselves classified students as “Cisgender” or “Trans/Gender Non-conforming” by comparing the answers to three questions:
- Question 67A “What sex were you assigned at birth?” (male, female, intersex)
- Question 67B “Do you identify as transgender?” (no, yes)
- Question 67C “Which term do you use to describe your gender identity?” (man/male, woman/female, trans woman, trans man, non-binary, genderqueer, agender, genderfluid, intersex, and "my identity is not listed").
Consistency between the reported sex (Q67A) and the two gender identity questions (Q67B, Q67C) led to a "cisgender" designation. Any discrepancy triggered the “trans/gender non-conforming” designation. Therefore, this designation is best understood as a broad proxy for transgender identity. As shown in Figure 4 below, 8.1% of female respondents were classified as "trans/gender non-conforming," compared to 4.7% of males. This aligns with reported patterns of higher rates of trans identification among females.
This is the only gender identity-related variable the researchers made available by sex, thus we were able to calculate the weighted average using sex ratios in U.S. college population. It was not a major adjustment since, while in raw data, about 70% of respondents were female, the population percentage is closer to 60%. The final weighted number by sex indicates that in 2025, the rate of U.S. undergraduate college student "non-cisgender" identification is at 6.7% (95% CI: 6.5%–6.9%).
A visual examination of the trend suggests stabilization between 2024-2025, but no decline as of the last measurement period.
Figure 4
Conclusion: Trans identification in college youth is at an all-time high but with evidence of plateau
The three methods used in ACHA-NCHA to estimate trans/nonbinary identification (based on Q67A,Q67B, and Q67C) discussed above, are summarized in Figure 5 below. They suggest the current rate is 4.7-6.7% (±02%)—an all-time high. At the same time, there is evidence of a plateau, primarily due to a leveling-off in the nonbinary identification rate.
Figure 5
In summary, the ACHA-NCHA data suggest that:
- As of spring 2025, the rate of overall "non-cisgender" identification on U.S. college campuses is at an all-time high, ranging between 4.7-6.7% (±0.2%), with a markedly higher rate among females (8.1%) as compared to males (4.7%).
- Between 2015 and 2025, the rate of trans identification on college campuses increased by at least three-fold. This followed an earlier five-fold increase between 2000 and 2015, from 0.1% to 0.5% (these data, not discussed in this Spotlight, are available from earlier ACHA-NCHA data reports).
- There appears to be a general plateau in transgender identities, driven by “nonbinary-type" identities.
- Because these trends are relatively recent, more longitudinal data are needed to confirm these early observations. Further, it is importnat to analyze the underlying raw data and apply statistical weights as appropraite, to ensure that the sample population mirrors the U.S. college population.
Our findings contradict two recent commentaries on survey data by Eric Kaufmann and Jean Twenge. Below, we explain why we think both Kaufmann's and Twenge's analyses are premature to conclude that transgender identities in youth are in a "free fall."
1. Analysis by Kaufmann using FIRE, HERI and other survey data
The analysis by Kaufmann used data from a number of surveys, including the Foundation for Individual Rights and Expression (FIRE), the Higher Education Research Institute (HERI) freshman survey, the Andover Phillips Academy annual student survey, the Brown Daily Herald spring and fall polls, and the Cooperative Election Study survey. Kaufmann reported a sharp decline in trans identification, see below:
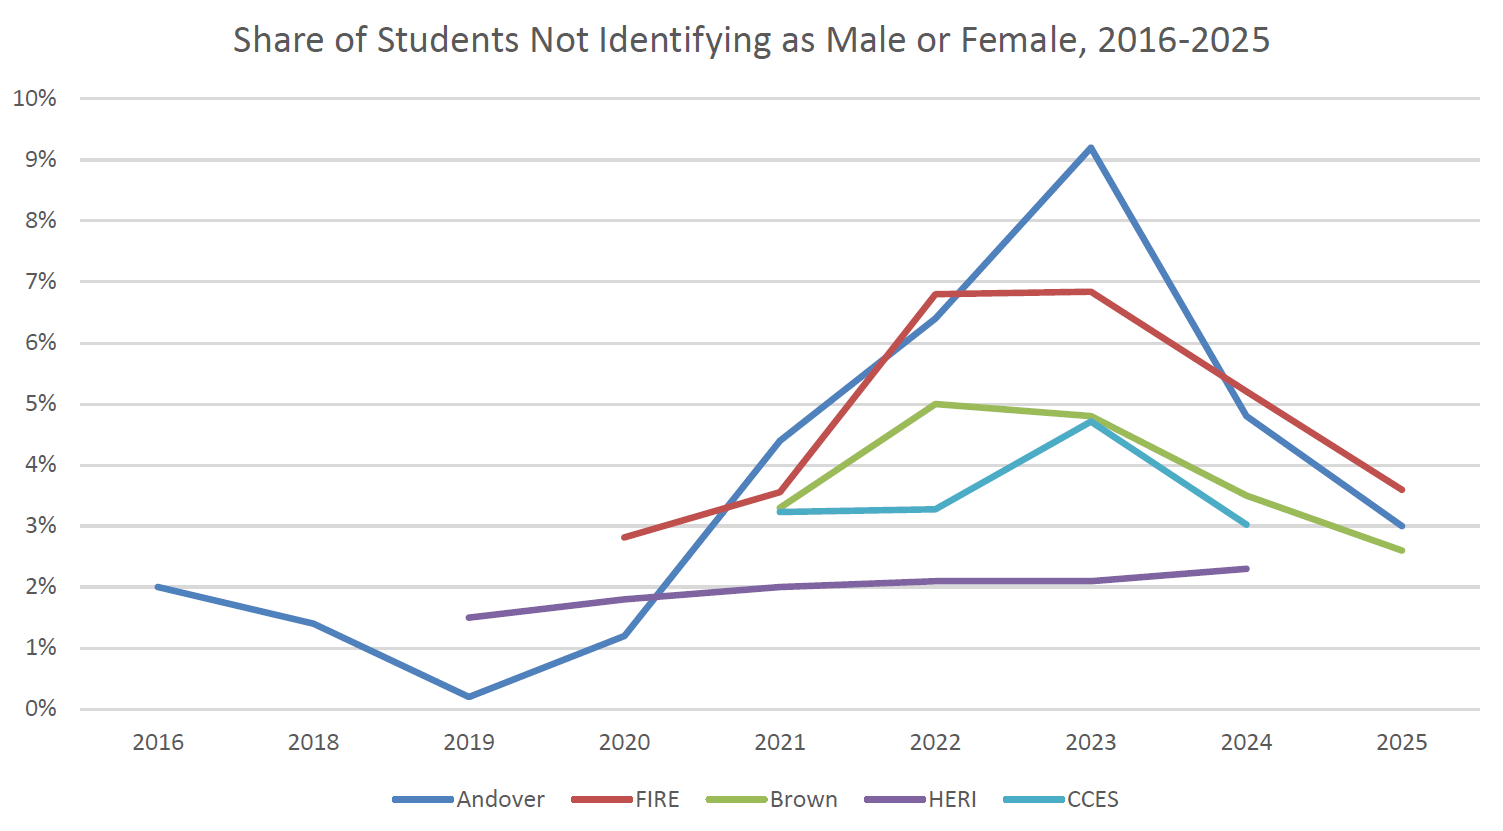
More recently, however, Kaufmann conceded that his conclusions hinge on the assumption that trans-identified individuals, when presented with “male,” “female,” and “other” as response options, will choose "other."
We do not think this assumption is sound and posit that binary trans-identified people (i.e., trans men and trans women) are more likely to choose "male" or "female" than "other." This suggests that, at best, what Kaufmann observed is a decline in non-binary trans identification. Even that conclusion requires verification by analyzing the question wordings and other issues related to the survey design and methodology that underpin the analysis.
2. Analysis by Twenge using Cooperative Election Study data
A subsequent analysis by Twenge used the data from the Cooperative Election Study (CES), which is a large-scale academic survey of American adults designed to capture political attitudes, demographic characteristics, and voting behavior. Because the CES sample is not representative, the survey provides several weights to help the sample approximate the U.S. population. Twenge analyzed the responses to two items of the CES, “Do you identify as transgender?” and “What is your gender?” (Of note, CES had another transgender-related question between years 2016 and 2020, but this question was discontinued.)
While Twenge disagreed with Kaufmann’s methods, her analysis reached a similar conclusion that transgender identification is in a “free fall":
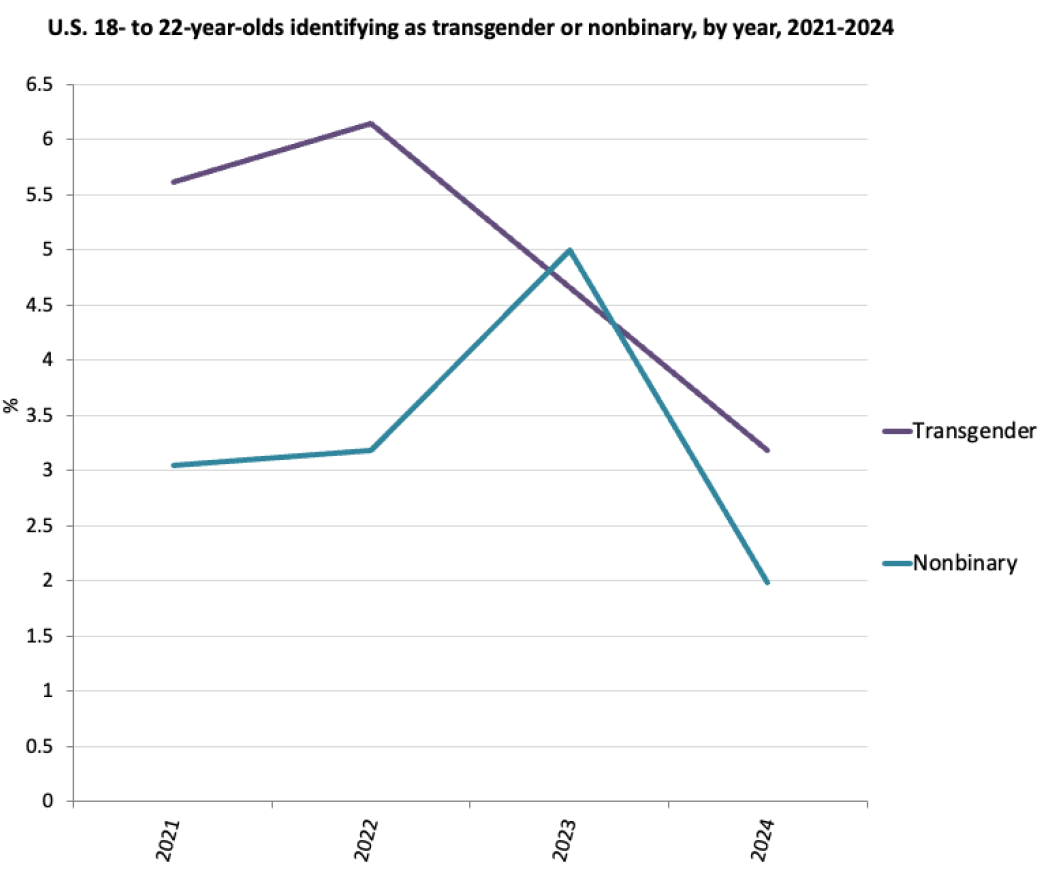
After reviewing Twenge’s analysis, we find the “free fall” characterization may be too strong because it hinges entirely on statistical weights applied to a small sub-sample. When raw, unweighted data are used, the rate of nonbinary identification slightly increases between 2023 and 2024. However, once the weights are applied, it creates a marked drop. A similar—but slightly less pronounced—dynamic occurs with the question regarding the broader transgender identification (see Figures 6 and 7 below).
A closer examination of statistical weights supplied by the CES (see Tables 2 and 3 below) suggests that the weights behave in a unusual way in 2024 as compared to prior years, by markedly shrinking the underlying raw counts of youth who claimed a transgender or nonbinary identity. In previous years, the weights also modified raw data, but typically in less significant ways. The large influence of weights on the 2024 findings limits any conclusions about the trend.
Figure 6
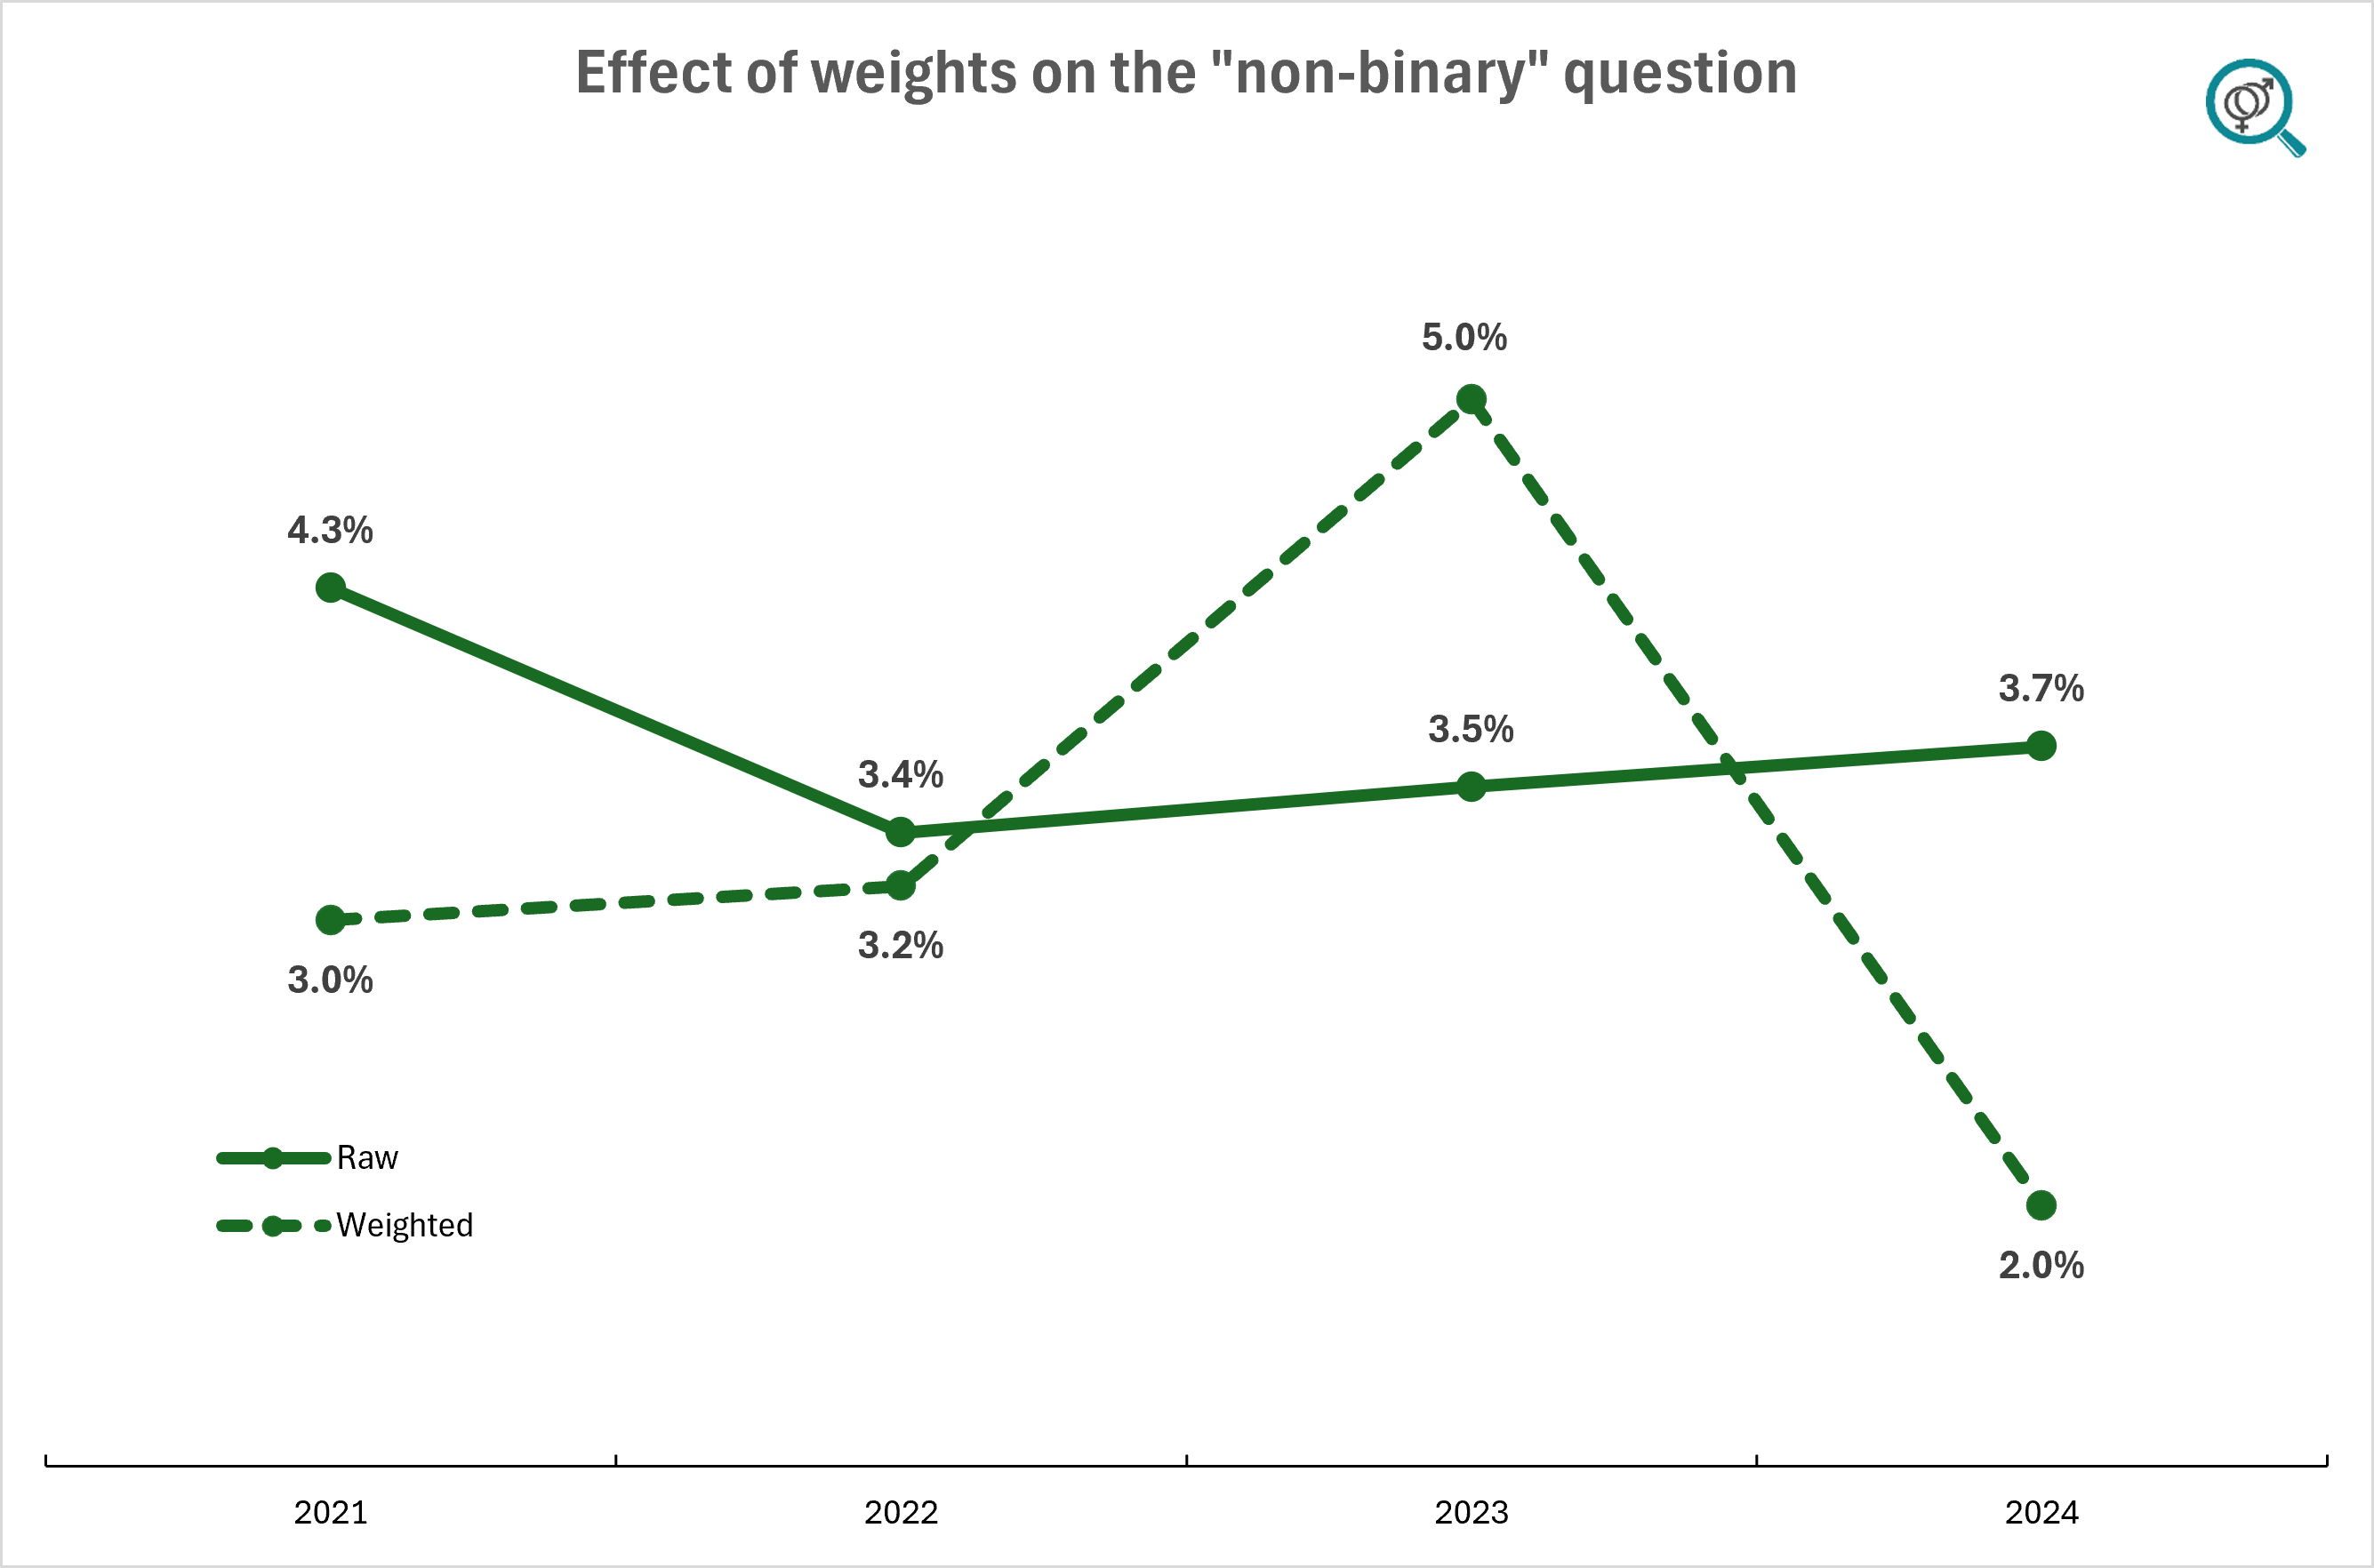
Figure 7
We provide additional detail below.
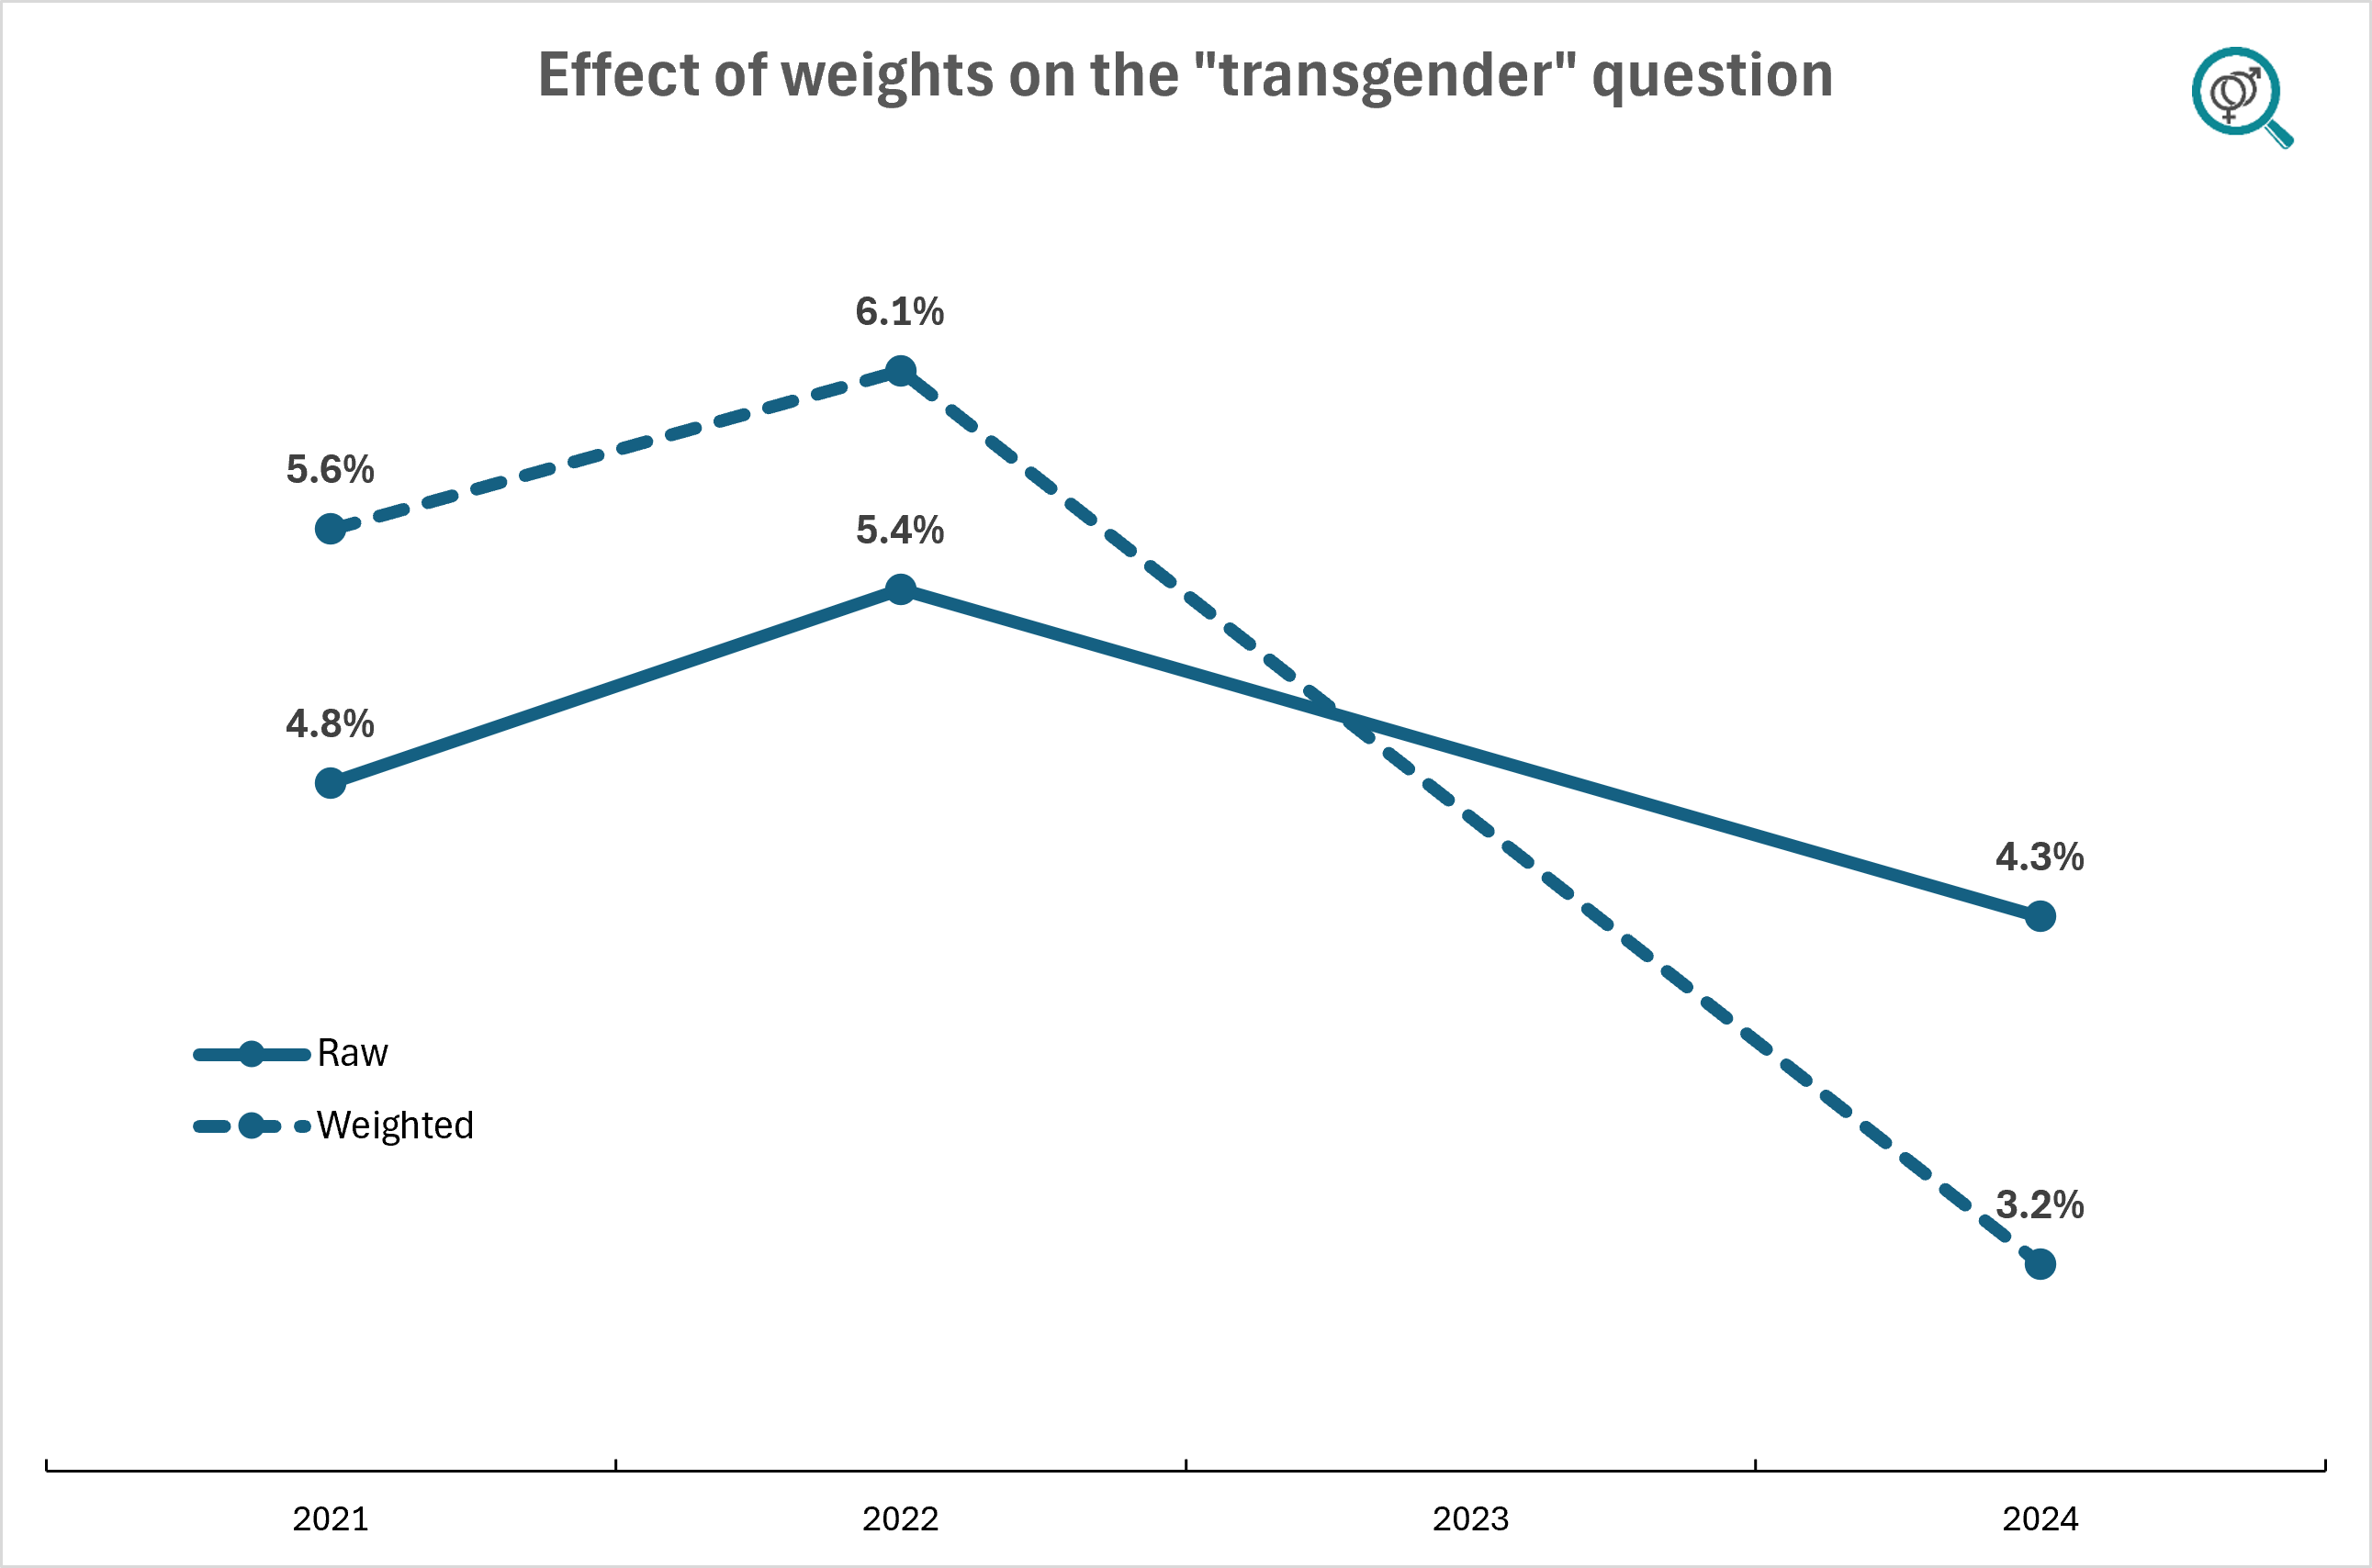
Transgender identity
Twenge uses affirmative answers to the question "Do you identify as transgender?" to conclude a marked decline in transgender identification among 18- to 22-year-olds, reporting a drop from 5.9% in 2022 to 3.1% in 2024 using weighted data. While this drop is statistically significant, the finding depends entirely on the use of statistical weights. The unweighted data show a smaller decrease from 5.4% in 2022 to 4.3% in 2024, which is only marginally statistically significant.
As the ratio of weighted to unweighted counts in Table 1 below shows, the weights behaved in an unusual way in 2024. While in prior years, the weights inflated the raw "transgender" counts by 9-14%, in 2024, the weights reduced the raw counts by 29% (100%-71%).
The fact that the number of people who refused or skipped the question (101 unweighted, 72 weighted) is roughly similarly-sized to the number of people who said they were transgender (136 unweighted, 98 weighted) further illustrates how assumption-dependent this finding is. To describe this as a "free fall" in transgender identification among youth is too strong.
Table 1
| 1,234 | 3,227 | 1,409 | 3,135 |
| 59 (4.8%) | 175 (5.4%) | NA | 136 (4.3%) |
| 67 (5.4%) | 192 (5.9%) | NA | 97 (3.1%) |
| 1.14 | 1.09 | NA | 0.71 |
Nonbinary identity
Twenge derives the nonbinary trend from responses to “What is your gender?” with options “man,” “woman,” “nonbinary,” and “other.” This analysis faces the same limitation noted above—its conclusions hinge entirely on weighting—and the effect is even stronger here. In the unweighted data, the share identifying as nonbinary rises slightly from 3.5% in 2023 to 3.7% in 2024. In the weighted data, however, it falls from 5% to 2%, a statistically significant drop.
As the ratio of weighted to unweighted counts in Table 2 below illustrates, weighting altered the underlying counts in a striking way. In 2023, weights inflated the raw nonbinary counts by about 41%, whereas in 2024, weights reduced the raw counts by about 46% (100%-54%). Such large, direction-reversing adjustments are concerning and require much faith in the validity of the weights.
Table 2
| 1,234 | 3,227 | 1,409 | 3,135 |
| 53 (4.3%) | 109 (3.4%) | 50 (3.5%) | 116 (3.7%) |
| 38 (3.1%) | 103 (3.2%) | 70 (5.0%) | 62 (1.9%) |
| 0.71 | 0.94 | 1.41 | 0.54 |
Applying weights: A double-edged sword
Although applying statistical weights can correct certain sample imbalances, it can also distort estimates—dramatically so when weights designed for an entire sample are applied to very small subgroups. In the dataset underlying Twenge’s analysis, the weights assigned to respondents aged 18–22 range from 0.0001 (meaning a person’s answer is effectively discounted to near zero) to 15 (meaning a single respondent’s answer counts as fifteen people). While this helps rebalance a large sample with respect to characteristics like age or sex, applying the same weights to a very small subgroup has the potential of distorting underlying trends.
In this case, weights created to adjust a sample of roughly 60,000 respondents for major demographic characteristics (e.g., age, sex, geography) were applied to a subgroup of transgender-identifying youth who make up <200 people (0.3%) of the total sample, see Table 3. In such a small subset, even a few respondents with an extreme weight can render the entire estimate unstable. While it is impossible to determine whether applying the weights improved the estimates or problematically distorted them, it is concerning that the entire finding hinges upon the weights designed for a large sample but applied to a small sub-sample.
Table 3
| 25,700 | 60,000 | 24,500 | 60,000 |
| 1,234 (4.8%) | 3,227 (5.4%) | 1,409 (5.8%) | 3,135 (5.2%) |
| 59 (0.2%) | 175 (0.3%) | NA | 136 (0.2%) |
| 53 (0.2%) | 109 (0.2%) | 50 (0.2%) | 116 (0.2%) |
SEGM Take-Away
The claims of a "free fall" of transgender and nonbinary identities are not strongly supported by the available data. Contrary to previously presented data, a multi-year analysis of college youth trans identification from ACHA-NCHA suggests that trans/nonbinary identities in youth are at an all-time high, albeit with evidence of reaching a plateau, largely driven by the leveling off in the incidence of nonbinary-type identities. Binary trans identities (especially trans men) appear to still be on the rise.
While we believe the dataset we used (ACHA-NCHA) is more robust than those relied on by Kaufmann and Twenge (in part because of large subsample of trans-identified youth, which is 2,000-3,000+ depending on the definition), it has significant limitations. Despite the large sample size, the average student response rate is about 10%. Further, we analyzed the publicly available information in ACHA reports, and have not engaged in obtaining the raw data which contains additional weights. Further still, the ACHA-NCHA data is limited to college students only, and trends among non-college youth may differ. These questions merit careful analysis. Still, our discordant findings and our analysis of the potential underlying problems in question wordings and weights used in prior analyses suggest that any conclusions about major changes in the trend of trans identification among youth, including conclusions of a "free fall," are premature.
Importantly, all the findings in this area are highly question-dependent. For instance, in ACHA-NCHA’s own survey, the share endorsing being “transgender” more than tripled (0.5% → 1.6%) from fall to spring 2015. While this rise may reflect the broader surge in trans identification around 2015 reported in many other data sources, the survey question phrasing shift likely had an outsized effect. The neutral question “What is your gender?” yielded roughly one-third as many “transgender” responses as the more direct question “Do you identify as transgender?” within just a single semester. This, in turn, suggests that comparisons of findings that relied on differently-worded questions are likely invalid.
Further, even identically worded questions may produce markedly different interpretations and non-comparable responses over time. As young people’s understanding of “transgender”—and society’s response to it—evolve, the same question can develop a different meaning over time, and may elicit unpredictable responses. For example, the CES dataset includes respondents who did not endorse any of the gender identities listed, and who instead selected "other," entering write-in responses such as "wombat," "attack helicopter," and "stop with this gender nonsense." At the same time, the question also elicited responses such as "GenderFluid TransMan," "trigender," and "lesbian born in a male body."
We conclude with the observation that discussions that deal with complex questions of survey design, weighting, and estimates of prevalence are best handled through publication in peer-reviewed journals. However, with journals often reluctant to host debates on trans identification among youth, platforms like Twitter/X and Substack have become de facto forums for timely discussion, and as such, have come to play a critical role in societal debates. We thank Eric Kaufmann and Jean Twenge for initiating this important discussion and debate.
Although we peer-reviewed our work internally, it is possible that our own analysis contains mistaken assumptions or errors. We welcome comments and critiques so we can improve our collective understanding of the prevalence of transgender and nonbinary identification among youth.


