.png)

- Article
- Open access
- Published: 08 April 2025
npj Metabolic Health and Disease volume 3, Article number: 13 (2025) Cite this article
-
9716 Accesses
-
273 Altmetric
Abstract
Consumption of ultra-processed foods (UPFs) increases overall caloric intake and is associated with obesity, cardiovascular disease, and brain pathology. There is scant evidence as to why UPF consumption leads to increased caloric intake and whether the negative health consequences are due to adiposity or characteristics of UPFs. Using the UK Biobank sample, we probed the associations between UPF consumption, adiposity, metabolism, and brain structure. Our analysis reveals that high UPF intake is linked to adverse adiposity and metabolic profiles, alongside cellularity changes in feeding-related subcortical brain areas. These are partially mediated by dyslipidemia, systemic inflammation and body mass index, suggesting that UPFs exert effects on the brain beyond just contributing to obesity. This dysregulation of the network of subcortical feeding-related brain structures may create a self-reinforcing cycle of increased UPF consumption.
Introduction
Modern environments offer foods that undergo extensive processing and combine macronutrients in ways never encountered in human history1,2,3. Processing has been integral to improvements in flavor, convenience, and shelf life4,5, but technological advancements in agro-industrial systems led to the manufacture of highly processed and energy-dense products, classified as ultra-processed foods (UPFs)6. A recent systematic review and meta-analysis of 28 studies across eight countries show that UPF consumption can reach 56% of total caloric intake7, a trend which is increasing globally8.
Evidence suggests that UPF consumption has been an important contributor to the increased prevalence of non-communicable diseases (NCDs) like diabetes or cardiovascular disease, but also cerebrovascular disease and dementia9,10,11,12. Li et al. reported that UPF consumption was associated with a higher risk of cognitive decline (dementia), and replacing 10% of the UPF weight in grams in the diet with minimally processed foods (MPFs) was related to a 19% lower risk of cognitive decline13. Similarly, in another sample, a 10% relative intake of UPF was associated with a higher risk of stroke and cognitive impairment, whereas consuming more MPFs and adhering to the Mediterranean, DASH (Dietary Approaches to Stop Hypertension) or MIND (Mediterranean-DASH Intervention for Neurodegenerative Delay) diet were related to a lower risk of cognitive impairment14.
A recent randomized trial conducted in a controlled clinical setting demonstrated that participants following an ultra-processed diet consumed more calories and gained more weight than those on minimally processed diets, establishing a causal link between UPF availability, overeating, and potentially obesity15. Obesity and associated metabolic markers and disorders (e.g., inflammation and hypertension) are related to cognitive decline and brain atrophy16,17. This likely constitutes one pathway for the influence of UPF consumption on the brain. At the same time, the literature suggests that UPFs can impact health through pathways independent of obesity, for example through emulsifiers, advanced glycation end-products or sweeteners that can, amongst others, lead to systemic inflammation and decline in brain health18,19. Importantly, according to previous animal studies, the influence of UPF consumption on brain areas involved in feeding behavior control might lead to further overconsumption of UPFs20.
In this study, we focus on associations between UPF consumption and structural brain integrity measures from magnetic resonance imaging (MRI) scans. We also (1) examine the effects of UPF consumption on adiposity, metabolic markers and nutrient intake, and (2) conduct mediation analyses to explore mechanisms linking UPF consumption and structural brain measures. Our goal is to determine whether UPF intake affects the brain via obesity-related metabolic changes or through mechanisms independent of obesity. Our research addresses a critical gap by exploring how UPF consumption impacts brain architecture through biological and neurological markers of disease.
Materials and Methods
Participants
This study was conducted using data from participants in the UK Biobank (UKBB), a large, multi-site cohort study21. The UKBB conducts longitudinal in-person and online deep phenotyping of over 500,000 individuals.
In-person data are collected during four main timepoints: initial assessment visit, follow-up assessment, first imaging assessment, and follow-up imaging assessment. Here, we only included participants who took part in the initial neuroimaging assessment, online dietary assessment, and had no neurological or thyroid disorders. Participants gave written informed consent and the study was approved by the North-West Multi-Centre Research Ethics Committee. All ethical regulations relevant to human research participants were followed. Our study was performed under study ID 45551. The overall sample size for this study was 33,654 (mean age at imaging assessment = 64.5 years, SD = 8 years; mean BMI = 26.09 kg/m2, SD = 4.01; 17,234 women); however, sample size for each analysis differs due to data availability, quality control, different processing strategies, as well as outlier removal (see below for more information). Approximate sample sizes for the analyses are: 33,654 for nutrient data, 30,000 for anthropometric data, blood markers, and blood pressure data (mean age = 64.5 years, mean BMI = 25.93 kg/m2, 15,131 women), 25,000 for cortical thickness, surface area, white matter diffusivity, and subcortical gray matter volumes (mean age = 64 years, mean BMI = 26.01 kg/m2, 13,501 women), and 16,000 for subcortical gray matter diffusivity and cellularity measures (mean age = 63 years, mean BMI = 25.96 kg/m2, 8,768 women).
Dietary assessment
The UKBB conducted online dietary assessments in 5 waves that took place after the initial assessment and prior to the neuroimaging assessment. For participants who filled out the assessment more than once, we averaged the final dietary variables (e.g., UPF consumption) across all their assessments. The distribution of the number of dietary assessments across participants was as follows: 1 assessment—9859 participants, 2 assessments—8000 participants, 3 assessments—8216 participants, 4 assessments—6541 participants, and 5 assessments—1149 participants. Intraclass correlation coefficient for UPF consumption indicated a good stability of the measure across all assessments (intraclass correlation coefficient = 0.7). The participation was voluntary and involved a 24 h dietary recall consisting of over 200 food items. Participants indicated the number of portions of each food item consumed during the 24 h period. This web-based dietary assessment was validated against an in-person assessment and was shown to provide similar results22. We estimated energy consumption for each item based on the number of portions consumed using data from23 and excluded all participants who reported consuming extreme amounts of calories, i.e less than 500 kcal and more than 5000 kcal (n = 111)24. Briefly, each food and beverage item portion was assigned an energetic value in kJ and kcal based on published standard data for the UK25,26. We then assigned each food item to one of 4 NOVA categories: unprocessed or minimally processed foods (NOVA 1), processed culinary ingredients (NOVA 2), processed foods (NOVA 3), and ultra-processed foods (NOVA 4)24. Consumed energy estimation and NOVA category assignment for all categories were done using 210 food items. UPF consumption was calculated as a percentage contribution of energy consumed from items in the NOVA 4 category to total energy intake during the past 24 h. On average and consistent with24, 46.6% of total energy intake was derived from UPF in this sample. Average total daily energy intake was 10,912 kJ (2,608 kcal). Additionally, we used daily consumption data of the following nutrients (automatically calculated by the UKBB from the 24 h dietary assessment): total sugar, sodium, and saturated fatty acids.
Blood biochemistry and blood pressure
Blood data collection was performed during the initial assessment, on average, 8 years prior to the neuroimaging assessment. Participants were non-fasted. Detailed blood sampling protocol can be found in Ref. 27. We used the following data obtained directly from the UKBB: blood levels of c-reactive protein (CRP), glycated hemoglobin A1c (HbA1c), high density lipoprotein (HDL), low density lipoprotein (LDL), and triglycerides (TG). Systolic and diastolic blood pressure were collected by trained personnel during the initial assessment.
Anthropometric data
BMI, waist-to-hip ratio (WHR) as well as visceral adipose tissue were collected by trained personnel during the neuroimaging assessment. Body weight and visceral adipose tissue were collected using Tanita BC418ma bioimpedance device (Tanita, Tokyo, Japan). We calculated WHR by dividing waist circumference by hip circumference.
Neuroimaging data
Neuroimaging data were collected using 3 T Siemens Skyra scanners at 3 sites in the UK. Imaging protocol details are described online at https://biobank.ctsu.ox.ac.uk/crystal/refer.cgi?id=2367 and in previous publications28. We processed T1-weighted and diffusion-weighted imaging (DWI) data as well as multiple imaging-derived phenotypes provided by the UKBB. Cortical thickness and surface area data for each parcel of the Desikan-Killiany-Tourville atlas29 obtained using FreeSurfer 6.0.0 were provided by the UKBB30. Volumes of subcortical structures obtained with Functional Magnetic Resonance Imaging of the Brain (FMRIB)’s Integrated Registration and Segmentation Tool (FIRST) were also provided by the UKBB31. Subcortical volume data were corrected for total brain volume prior to analyses. White matter fractional anisotropy (FA) and mean diffusivity (MD) for 48 standard Johns Hopkins University atlas parcels were computed using in-house scripts and provided by the UKBB32,33. Whole-brain intracellular volume fraction (ICVF) and isotropic volume fraction (ISOVF) were obtained from the UKBB (https://biobank.ctsu.ox.ac.uk/crystal/crystal/docs/brain_mri.pdf; https://github.com/daducci/AMICO34,35). We calculated FA and MD whole-brain maps using the TractoFlow pipeline (version 2.3.0)36,37,38,39,40,41,42 and the preprocessing workflow specified in https://github.com/neurodatascience/tractoflow_UKBB. It is proposed that ICVF, ISOVF, FA, and MD reflect the degree of water diffusion, and, in gray matter, are said to reflect cellularity and amount of extracellular space34,43. Increased MD typically indicates reduced tissue density and lower structural integrity, while higher FA suggests greater white matter organization and integrity; intracellular volume fraction (ICVF) reflects the density of neurites (axons and dendrites) while isotropic volume fraction (ISOVF) represents the proportion of free water, with higher ICVF and lower ISOVF generally indicating better tissue microstructural organization35,43. From the ICVF, ISOVF, FA, and MD whole-brain maps, we extracted data for subcortical gray matter structures parcellated based on the Xiao atlas44 and the Lead_DBS Atlas of the Human Hypothalamus45. The hypothalamic mask consisted of 14 merged regions of interest—the anterior hypothalamic area, arcuate hypothalamic nucleus, dorsal periventricular hypothalamic nucleus, dorsomedial hypothalamic nucleus, lateral hypothalamus, mammillary bodies, medial preoptic nucleus, paraventricular nucleus, periventricular hypothalamic nucleus, posterior hypothalamic nucleus, suprachiasmatic hypothalamic nucleus, supraoptic hypothalamic nucleus, tuberomammillary hypothalamic nucleus, and the ventromedial hypothalamus. Whole-brain ICVF, ISOVF, FA, and MD maps were registered to the MNI template using Advanced Normalization Tools41, and region of interest data were extracted using binarised masks. Scripts for these steps are available at https://github.com/HoumanAzizi/UKB_DTI_Pipeline.
Statistical analysis
All statistical analyses were done in R (version 4.3.1). Data analysis scripts can be found at https://github.com/FilipMorys/UPF_study. First, for all data apart from UPF consumption, outliers were excluded based on a 2.2 interquartile range multiplier below the first and above the third quartile (average ratio of outliers removed per variable: 0.88%; range: 0–6.3%; see Supplementary Data 1 for details)46. This was done to ensure quality of the data. We did not perform this step for UPF consumption data as we already excluded individuals with unusually high or low daily energy intake. Next, to investigate the associations between UPF consumption and blood, blood pressure, anthropometric, and nutrient consumption measures, we used the general linear model (GLM) analysis. To investigate the associations between UPF consumption and brain measures, we ran GLM analyses using brain measures as outcome variables and UPF consumption as a predictor variable. Finally, we conducted post-hoc mediation analyses to explore potential mechanisms underlying the associations between UPF consumption and brain measures. Mediation analyses were performed using the mediation package in R and p values were assessed using 100 quasi-Bayesian Monte Carlo simulations47. Criteria for significant mediation were: (1) significant total effect; (2) significant mediation effect; and (3) positive value of mediated proportion of the total association. Importantly, in all GLM and mediation analyses (for all paths) we used a number of covariates to control for variables that might potentially influence UPF consumption as well as brain phenotypes. As recommended, the UKBB specific covariates included age, sex, age*sex, age2, age2*sex, site, head size (for cortical gray matter analyses), neuroimaging data acquisition date, time difference between the beginning of neuroimaging data acquisition and each individual participant’s data acquisition, and time difference-squared48. The study-specific covariates included intake of saturated fatty acids, total sugar intake, sodium intake, BMI, total energy intake, education, total household income, smoking status, alcohol consumption, as well as physical activity (number of days a week in which participants performed vigorous physical activity). In the analysis investigating the relationship between UPF consumption and metabolic, anthropometric, and nutrient consumption measures only the UKBB specific covariates were included. All GLM analyses were repeated with no covariate inclusion to investigate the influence of all covariates on the amount of variance in the outcome measures explained by the UPF consumption as well as model fit. The partial R2 and Akaike Information Criterion values for UPF consumption for both models can be found in Supplementary Data. Overall, partial R2 decreased and model fit improved after covariate inclusion. We also repeated all GLM analyses without BMI as a covariate to see whether BMI affected the tested associations. In mediation analyses in which BMI was used as a mediator, we did not include BMI as a covariate. We found no evidence of multicollinearity between the covariates (maximum value of variance inflation factor = 1.80). The α significance threshold was set at 0.05, and all p-values were corrected for multiple comparisons using false discovery rate Benjamini-Hochberg correction49. This was done separately for each tested modality, e.g., biometrics, cortical thickness or subcortical volumes.
Results
Associations between UPF consumption, nutrient intake, obesity, and metabolic variables
We found significant negative associations between UPF consumption, HDL levels and blood pressure, as well as positive correlations between UPF consumption and blood CRP and TG levels, HbA1c, BMI, waist-to-hip ratio, visceral adipose tissue, and total sugar, sodium, and saturated fatty acid consumption (Fig. 1, Supplementary Data 2). This indicates that UPF consumption is related to a range of cardiometabolic, anthropometric, and dietary measures.
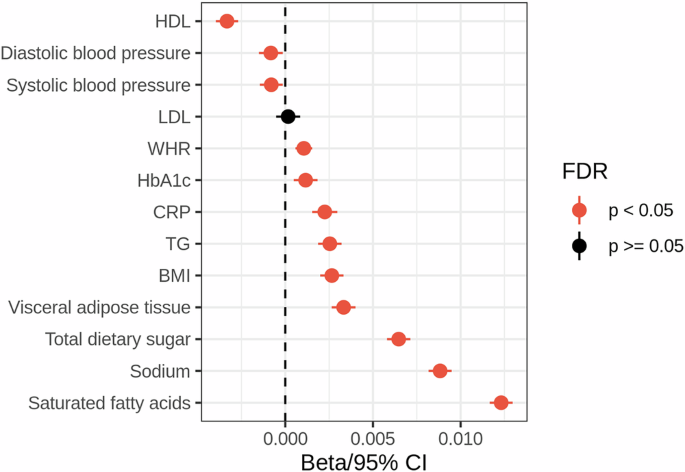
CI - confidence intervals. FDR - false discovery rate. HDL - high density lipoprotein. LDL - low density lipoprotein. HbA1c - glycated hemoglobin A1c. CRP - c-reactive protein. TG - triglycerides. WHR - waist-to-hip ratio.
Associations between UPF consumption and brain structure
No significant associations were found between UPF consumption and cortical surface area or volumes of subcortical structures (Fig. 2, Supplementary Data 3–4). We found a significant association between UPF consumption and higher cortical thickness in the bilateral lateral occipital cortex (Fig. 2, Supplementary Data 3). UPF consumption was positively associated with MD and negatively associated with ICVF in the right nucleus accumbens (Fig. 3, Supplementary Data 4–5). UPF consumption was negatively associated with MD in the hypothalamus (Fig. 3, Supplementary Data 5). UPF consumption was also associated with lower ICVF in the bilateral pallidum and putamen, as well as lower ISOVF in the left amygdala and thalamus (Fig. 3, Supplementary Data 6). In white matter, UPF consumption was positively associated with FA in the left fornix cres/stria terminalis, fornix, and genu of corpus callosum, as well as negatively associated with MD in the right fornix cres/stria terminalis (Fig. 2, Supplementary Data 7). After excluding BMI as a covariate from the GLMs, we found positive associations between UPF consumption and cortical thickness in the bilateral lateral occipital cortex and left cuneus, between UPF consumption and MD in the right fornix cres/stria terminalis, hypothalamus, and right nucleus accumbens, FA in the bilateral hippocampus, right amygdala, and left fornix cres/stria terminalis, as well as ICVF in the right nucleus accumbens (Supplementary Fig. 1, Supplementary Data 8–12). Relationships that became significant only after excluding BMI as a covariate—thickness of the left cuneus, FA in the bilateral hippocampus and the right amygdala—are likely driven by BMI rather than UPF consumption. Interestingly, the associations between UPF consumption and ICVF in the bilateral pallidum and putamen, FA in the fornix, and genu of corpus callosum, as well as ISOVF in the left amygdala and thalamus were rendered non-significant after excluding BMI as a covariate, indicating a potential suppression effect of BMI (Supplementary Fig. 1). This could imply that BMI mediates the effect between UPF consumption and these brain characteristics.
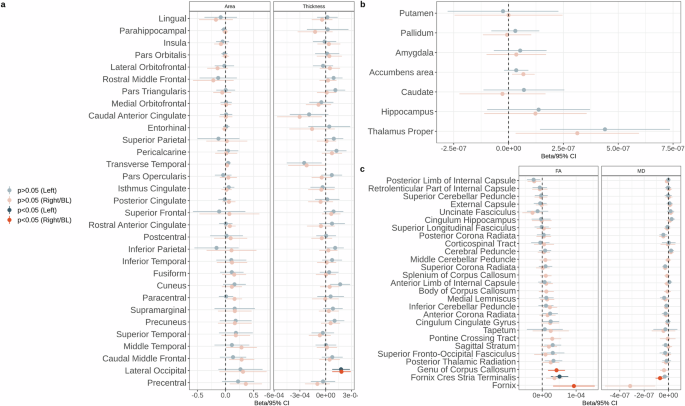
a Cortical area and cortical thickness; b subcortical volumes; c white matter FA and MD. CI confidence intervals. FA fractional anisotropy. MD mean diffusivity. BL bilateral.
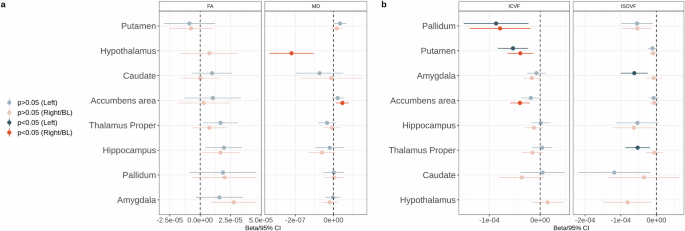
a Subcortical gray matter FA and MD; b subcortical gray matter ICVF and ISOVF. CI confidence intervals. FA fractional anisotropy. MD mean diffusivity. ICVF intracellular volume fraction. ISOVF isotropic volume fraction. BL bilateral.
Post-hoc mediation analyses
To investigate mechanisms behind the UPF consumption-brain associations, we performed mediation analyses. First, we wanted to determine which metabolic variables can mediate the relationship between UPF consumption and brain phenotypes. We focused on four metabolic variables that were significantly associated with UPF consumption: CRP, TG, HbA1c, and HDL. As a prerequisite for the mediation analysis, we tested the associations between these metabolic variables and brain phenotypes that were significantly associated with UPF consumption. Here, CRP was significantly related to FA in the fornix, left fornix cres/stria terminalis, and negatively associated with ICVF in the bilateral pallidum, as well as MD in the right nucleus accumbens. HbA1c was positively associated with cortical thickness in the right lateral occipital cortex, FA in the fornix, as well as negatively associated with ICVF in the left pallidum. HDL levels were positively associated with FA in the fornix and cortical thickness in the bilateral lateral occipital cortex. Finally, TG levels were associated negatively with ICVF in the right nucleus accumbens (Fig. 4, Supplementary Data 13). In the mediation analysis, we found that higher UPF consumption was related to higher blood CRP levels, which in turn was associated with higher MD in the right nucleus accumbens (1.4% proportion mediated; Fig. 4, Supplementary Data 14). We also show that higher UPF consumption was related to lower blood HDL levels, which was related to lower thickness in the bilateral lateral occipital cortex, as well as lower FA in the fornix (proportion mediated: 3.7% in the left occipital cortex, 4.96% in the right occipital cortex, and 4.13% in the fornix, Fig. 4, Supplementary Data 14). Finally, to investigate an alternative pathway of influences of UPF on the brain, we tested whether BMI mediated the associations between UPF consumption and all significantly related brain phenotypes. We found that higher UPF consumption was related to higher BMI, which was in turn related to lower MD in the hypothalamus, lower MD in the right fornix cres/stria terminalis, as well as higher cortical thickness in the bilateral lateral occipital cortex (proportion mediated: 1.6% in the hypothalamus, 2.67% in the fornix cres/stria terminalis, 7.38% in the left as well as 7.88% in the right lateral occipital cortex, Fig. 4, Supplementary Data 14). Thus, the mechanisms associating UPF consumption with brain changes seem to be driven by both adiposity and metabolic factors.
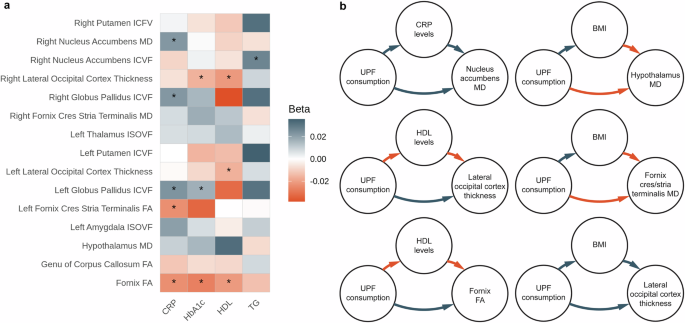
a Relationships between metabolic variables and brain phenotypes; b schematic representations of significant mediation analyses; red arrows represent negative associations, gray arrows represent positive associations. MD - mean diffusivity. ICVF - intracellular volume fraction. ISOVF - isotropic volume fraction. FA - fractional anisotropy. CRP - C-reactive protein. HbA1c - glycated hemoglobin A1c. HDL - high density lipoprotein. TG - triglycerides. UPF - ultra-processed food. BMI - body mass index.
Discussion
The consumption of industrially processed foods is on the rise50. UPF consumption increases overall caloric intake as well as intake of UPF-specific additives and has negative effects on the body, leading to an increased risk of obesity, cardiovascular disease, cognitive decline, and dementia9,10,18,19,50,51. Preliminary studies indicate that UPF can also cause brain changes, although these studies often have low sample sizes52,53. To expand on these associations, we investigated whether UPF consumption is related to brain structure in a large cohort of middle-aged individuals. The goal was to determine whether the associations between UPF consumption and brain structure are driven only by adiposity or other factors. Here, we report that UPF consumption was related to altered tissue microstructure based on diffusion MRI in multiple structures important in the control of feeding: the nucleus accumbens, hypothalamus, pallidum, putamen, and amygdala. Specifically, we found that UPF consumption was associated with lower MD in the hypothalamus, indicative of increased cellularity. This has been previously shown to reflect gliosis20,54,55. Conversely, in the nucleus accumbens, putamen, and pallidum, UPF consumption correlated with measures of reduced cellularity and increased water content, namely higher MD and lower ICVF, which could reflect neurodegenerative processes. We explored potential mechanisms underpinning these relationships, including metabolic markers and indicators of adiposity. Our findings link higher UPF consumption to altered metabolic markers, increased obesity, and changes in brain regions involved in feeding behavior. We also show that brain changes related to UPF consumption might be driven by dyslipidemia, inflammation or adiposity itself. We discuss the implications of these results below.
It is well-established that dietary patterns influence inflammation (e.g., plasma CRP, Interleukin 6 and 8), adiposity (BMI, WC, WHR, VAT), blood pressure, blood glucose, and lipid profiles (HDL, LDL, TG), and that these factors might lead to brain changes and cognitive decline15,16,24,56,57,58,59,60,61,62,63,64,65,66,67,68,69,70,71. Our results are in line with these findings. Importantly, we show a positive correlation between CRP levels and higher UPF consumption (Fig. 1). In this context, our findings corroborate previous studies investigating the effect of a diet high in UPFs on inflammation. More specifically, in an Australian sample, a 100-gram increase in UPFs was associated with a 2.5% increase in high-sensitivity CRP independently of BMI in men but not women72. Similarly, in three different samples, including adolescents, UPF consumption resulted in a 79% increase in interleukin 8 levels73 and a higher interleukin 6 concentration unrelated to adiposity among males and females74. Despite some data showing that the association between UPF consumption and inflammation disappeared after BMI adjustment72,74,75, research suggests that the additives (e.g., emulsifiers, microparticles) often found in UPFs can cause gut dysbiosis leading to immune cell dysregulation and inflammatory responses76. Moreover, our results show that UPF intake is associated with higher HbA1c and TG levels and lower HDL levels (Fig. 1). This corroborates previous work from 13 studies showing that moderate and high UPF consumption increases diabetes risk (i.e., blood glucose levels)65. It is also in line with results from a Spanish cohort showing a significant relationship between UPF consumption and low HDL as well as high TG levels, yet no associations with LDL levels68. In both cases, the data were adjusted for adiposity measures (mostly BMI); thus, it is conceivable that UPFs negatively affect health independent of obesity.
Animal studies using sucrose as a proxy for highly processed foods demonstrate that these foods possess a high reinforcement value77. This value signal drives behavior and is generated in brain structures such as the nucleus accumbens78,79 and might be related to UPFs’ ability to drive food seeking and consumption80. Indeed, studies show that changes in the reward system could be a consequence of UPF consumption in humans52,53 and in mice81,82,83. In children, dietary fat consumption and waist circumference are significantly associated with higher accumbens cellularity as measured by restriction spectrum imaging84,85. Here, conversely, we found that UPF consumption in adults was associated with higher MD and lower ICVF in the nucleus accumbens as well as lower ICVF in the pallidum and putamen (Fig. 3a, b). Both measures suggest a decreased number of cell bodies and an increased volume of extracellular space35,43. This is characteristic of a neurodegenerative process that can follow, amongst others, neuroinflammation20,86. Such a neuroinflammatory process is likely at play here, given that the accumbens and pallidum-UPF relationship was partially mediated by blood CRP levels. A bi-directional association is possible, whereby UPF consumption increases our desire to eat more UPFs by influencing reward signals in the nucleus accumbens through inflammation (higher CRP) and, as our results suggest, independent of BMI. We suggest a similar mechanism might be taking place with TG levels and ICVF in the nucleus accumbens. Moreover, it is also likely that the pallidum is involved in this bidirectional loop, as there is evidence from rats and humans that it possesses neurons sensitive to reward87,88,89, which can guide food decisions90. In addition, our results show microstructural changes (ISOVF) in the left amygdala and thalamus with higher UPF consumption. This is a compelling finding, given that the amygdala plays a pivotal role in regulating feeding behavior related to reward91. Additionally, the thalamus is an integrative node for emotional and motivated behaviors, such as fear and reward-seeking92. Our post-hoc analysis also revealed that HbA1c also mediated the UPF-pallidum relationship, demonstrating that the rise in long-term blood sugar level markers associated with increased UPF consumption mediates the changes in cell body numbers and extracellular space. Given the rise in sugar intake linked to UPF consumption (Fig. 1), these results add to the evidence that UPF consumption affects reward-related decisions.
We also highlight the finding that UPF consumption was related to restricted diffusion of water molecules in the hypothalamus and, therefore, likely higher cell density (Fig. 3a). These changes are characteristic of neuroinflammation at the stage of gliosis20. We show here that BMI mediated the relationship between UPF consumption and hypothalamic MD, which is in line with our previous findings in the same sample, showing that hypothalamic MD was negatively associated with BMI86. Therefore, UPF consumption could lead to adiposity, which could lead to increased hypothalamic cellularity. Animal studies show that a high-fat diet can lead to rapid changes in hypothalamic cellular structure, which can in turn lead to hyperphagia and adiposity20,93. Thus, an elevated intake of UPFs might raise the risk of exhibiting a metabolic disease and damage the structural integrity of the hypothalamus. In general, the damage to the hypothalamus-accumbens neural circuit involved in food liking and wanting94 might favor maladaptive eating (i.e., more UPFs) and metabolic diseases further perpetuating a vicious cycle.
Another mechanism that may influence maladaptive eating is the behavioral phenotype of Uncontrolled Eating95,96. We found that UPF consumption was related to changes in FA in the stria terminalis (Fig. 2c), a white matter tract connecting the hypothalamus and the amygdala97, potentially linking UPF consumption with Uncontrolled Eating processes98, in which the amygdala and medial temporal lobe are engaged95,96,99. Consequently, the proposed mechanism can be integrated into the bi-directional cycle of UPF-brain interactions, elevating the overconsumption of UPFs and the aforementioned metabolic consequences.
Most UPF studies are observational in nature, relying on cross-sectional and prospective cohorts10. Hence, several researchers proposed that any negative effects associated with UPF consumption can be attributed to nutritional factors, such as a diet low in fiber and high in saturated fat, sugar, and sodium100,101. However, observational data persistently link UPFs with adverse health outcomes, even after adjusting for diet quality, nutrients (e.g., saturated fatty acids), and healthy dietary patterns, such as the Mediterranean diet or Healthy Diet Score11. To address this controversy, we included nutrients that are commonly linked with disease prevalence (total sugar, saturated fat, and sodium) as covariates in our main analysis, as well as total daily caloric intake. We also controlled for a large number of covariates that might influence eating behavior. Thus, our results were independent of nutrient content, socioeconomic status, physical activity, or smoking and alcohol consumption. Nonetheless, given the observational nature of the study and small effect sizes, we cannot exclude the fact that food processing is only part of the equation of the influence of UPF on the brain. We also cannot establish the causal directionality of UPF consumption-brain associations.
In sum, we present evidence that eating UPFs increases several nutrient and metabolic markers of disease and is associated with structural brain changes in areas that regulate eating behavior. Based on our findings and available literature, we hypothesize that a vicious cycle of UPF-brain associations is possible, where UPF consumption might lead to changes in the brain both via adiposity and other mechanisms, e.g., low-grade systemic inflammation, and that changes in those feeding-related brain areas might further lead to Uncontrolled Eating. These findings provide insight into how UPF consumption may perpetuate itself while contributing to adverse health effects.
Data availability
No datasets were generated or analysed during the current study. Data used in this study are available through the UKBB consortium upon request.
Code availability
The underlying code for this study is available on GitHub and can be accessed via this link: https://github.com/FilipMorys/UPF_study.
References
Small, D. M. & DiFeliceantonio, A. G. Processed foods and food reward. Science 363, 346–347 (2019).
Cordain, L. et al. Plant-animal subsistence ratios and macronutrient energy estimations in worldwide hunter-gatherer diets. Am. J. Clin. Nutr. 71, 682–692 (2000).
Monteiro, C. A., Moubarac, J. C., Cannon, G., Ng, S. W. & Popkin, B. Ultra-processed products are becoming dominant in the global food system. Obes. Rev. Off. J. Int. Assoc. Study Obes. 14 Suppl 2 https://doi.org/10.1111/obr.12107 (2013).
Sadler, C. R. et al. Processed food classification: Conceptualisation and challenges. Trends Food Sci. Technol 112, 149–162 (2021).
Knorr, D., Augustin, M. A. & Tiwari, B. Advancing the role of food processing for improved integration in sustainable food chains. Front. Nutr. 7, 34 (2020).
Monteiro, C. A. et al. Ultra-processed foods: what they are and how to identify them. Public Health Nutr 22, 936–941 (2019).
Lane, M. M. et al. Ultraprocessed food and chronic noncommunicable diseases: a systematic review and meta-analysis of 43 observational studies. Obes. Rev. 22, e13146 (2021).
Baker, P. et al. Ultra-processed foods and the nutrition transition: global, regional and national trends, food systems transformations and political economy drivers. Obes. Rev. 21, e13126 (2020).
Lane, M. M. et al. Ultra-processed food exposure and adverse health outcomes: umbrella review of epidemiological meta-analyses. BMJ 384, e077310 (2024).
Crimarco, A., Landry, M. J. & Gardner, C. D. Ultra-processed foods, weight gain, and co-morbidity risk. Curr. Obes. Rep. 11, 80–92 (2022).
Dicken, S. J. & Batterham, R. L. The Role of Diet Quality in Mediating the Association between Ultra-Processed Food Intake, Obesity and Health-Related Outcomes: A Review of Prospective Cohort Studies. Nutrients 14, 23 (2022).
Juul, F., Vaidean, G., Lin, Y., Deierlein, A. L. & Parekh, N. Ultra-Processed Foods and Incident Cardiovascular Disease in the Framingham Offspring Study. J. Am. Coll. Cardiol. 77, 1520–1531 (2021).
Li, H. et al. Association of Ultraprocessed Food Consumption With Risk of Dementia: A Prospective Cohort Study. Neurology 99, e1056–e1066 (2022).
Bhave, V. M. et al. Associations Between Ultra-Processed Food Consumption and Adverse Brain Health Outcomes. Neurology 102, e209432 (2024).
Hall, K. D. et al. Ultra-Processed Diets Cause Excess Calorie Intake and Weight Gain: An Inpatient Randomized Controlled Trial of Ad Libitum Food Intake. Cell Metab 30, 67–77.e3 (2019).
Morys, F., Dadar, M. & Dagher, A. Association Between Midlife Obesity and Its Metabolic Consequences, Cerebrovascular Disease, and Cognitive Decline. J. Clin. Endocrinol. Metab. 106, e4260–e4274 (2021).
Medawar, E. & Witte, A. V. Impact of obesity and diet on brain structure and function: a gut–brain–body crosstalk. Proc. Nutr. Soc. 1–11 (2022).
D’Cunha, N. M. et al. The Effects of Dietary Advanced Glycation End-Products on Neurocognitive and Mental Disorders. Nutrients 14, 2421 (2022).
Tristan Asensi, M., Napoletano, A., Sofi, F. & Dinu, M. Low-Grade Inflammation and Ultra-Processed Foods Consumption: A Review. Nutrients 15, 1546 (2023).
Sewaybricker, L. E., Huang, A., Chandrasekaran, S., Melhorn, S. J. & Schur, E. A. The significance of hypothalamic inflammation and gliosis for the pathogenesis of obesity in humans. Endocr. Rev. 44, 281–296 (2022).
Sudlow, C. et al. UK Biobank: An Open Access Resource for Identifying the Causes of a Wide Range of Complex Diseases of Middle and Old Age. PLoS Med. 12, e1001779 (2015).
Liu, B. et al. Development and evaluation of the Oxford WebQ, a low-cost, web-based method for assessment of previous 24 h dietary intakes in large-scale prospective studies. Public Health Nutr. 14, 1998–2005 (2011).
Chen, X. et al. Associations of ultra-processed food consumption with cardiovascular disease and all-cause mortality: UK Biobank. Eur. J. Public Health 32, 779–785 (2022).
Rauber, F. et al. Ultra-processed food consumption and risk of obesity: a prospective cohort study of UK Biobank. Eur. J. Nutr. 60, 2169–2180 (2021).
England, P. H. McCance and Widdowson’s The Composition of Foods Integrated Dataset 2021. (2021).
Agency, F. S. Food Portion Sizes 3rd ed. (TSO) (1993).
Elliott, P., Peakman, T. C. & on behalf of UK Biobank The UK Biobank sample handling and storage protocol for the collection, processing and archiving of human blood and urine. Int. J. Epidemiol. 37, 234–244 (2008).
Miller, K. L. et al. Multimodal population brain imaging in the UK Biobank prospective epidemiological study. Nat. Neurosci. 19, 1523–1536 (2016).
Klein, A. & Tourville, J. 101 Labeled Brain Images and a Consistent Human Cortical Labeling Protocol. Front. Neurosci. 6 https://doi.org/10.3389/fnins.2012.00171 (2012).
Fischl, B. FreeSurfer. NeuroImage 62, 774–781 (2012).
Patenaude, B., Smith, S. M., Kennedy, D. N. & Jenkinson, M. A Bayesian model of shape and appearance for subcortical brain segmentation. NeuroImage 56, 907–922 (2011).
Wakana, S. et al. Reproducibility of quantitative tractography methods applied to cerebral white matter. NeuroImage 36, 630–644 (2007).
Mori, S., Wakana, S., Nagae-Poetscher, L. M. & van Zijl, P. C. M. MRI Atlas of Human White Matter. Am. J. Neuroradiol. 27, 1384–1385 (2006).
Daducci, A. et al. Accelerated Microstructure Imaging via Convex Optimization (AMICO) from diffusion MRI data. NeuroImage 105, 32–44 (2015).
Zhang, H., Schneider, T., Wheeler-Kingshott, C. A. & Alexander, D. C. NODDI: Practical in vivo neurite orientation dispersion and density imaging of the human brain. NeuroImage 61, 1000–1016 (2012).
Theaud, G. et al. TractoFlow: A robust, efficient and reproducible diffusion MRI pipeline leveraging Nextflow & Singularity. NeuroImage 218, 116889 (2020).
Kurtzer, G. M., Sochat, V. & Bauer, M. W. Singularity: Scientific containers for mobility of compute. PLoS ONE 12, e0177459 (2017).
Di Tommaso, P. et al. Nextflow enables reproducible computational workflows. Nat. Biotechnol. 35, 316–319 (2017).
Garyfallidis, E. et al. Dipy, a library for the analysis of diffusion MRI data. Front. Neuroinformatics 8, 8 (2014).
Tournier, J.-D. et al. MRtrix3: A fast, flexible and open software framework for medical image processing and visualisation. Neuroimage 202, 116137 (2019).
Avants, B., Tustison, N. J. & Song, G. Advanced Normalization Tools: V1.0. Insight J https://doi.org/10.54294/uvnhin (2009).
Jenkinson, M., Beckmann, C. F., Behrens, T. E. J., Woolrich, M. W. & Smith, S. M. FSL. NeuroImage 62, 782–790 (2012).
Alexander, A. L., Lee, J. E., Lazar, M. & Field, A. S. Diffusion tensor imaging of the brain. Neurother. J. Am. Soc. Exp. Neurother. 4, 316–329 (2007).
Xiao, Y. et al. An accurate registration of the BigBrain dataset with the MNI PD25 and ICBM152 atlases. Sci. Data 6, 210 (2019).
Neudorfer, C. et al. A high-resolution in vivo magnetic resonance imaging atlas of the human hypothalamic region. Sci. Data 7, 305 (2020).
Hoaglin, D. C. & Iglewicz, B. Fine-Tuning Some Resistant Rules for Outlier Labeling. (1987).
Tingley, D., Yamamoto, T., Hirose, K., Keele, L. & Imai, K. mediation: R Package for Causal Mediation Analysis. J. Stat. Softw. 59 https://doi.org/10.18637/jss.v059.i05 (2014).
Alfaro-Almagro, F. et al. Confound modelling in UK Biobank brain imaging. NeuroImage 224, 117002 (2021).
Benjamini, Y. & Hochberg, Y. Controlling the False Discovery Rate: A Practical and Powerful Approach to Multiple Testing. J. R. Stat. Soc. Ser. B Methodol. 57, 289–300 (1995).
Torres-Collado, L. et al. A high consumption of ultra-processed foods is associated with higher total mortality in an adult Mediterranean population. Clin. Nutr. 43, 739–746 (2024).
Srour, B. et al. Ultra-processed food intake and risk of cardiovascular disease: prospective cohort study (NutriNet-Santé). BMJ 365, l1451 (2019).
Burger, K. S. Frontostriatal and behavioral adaptations to daily sugar-sweetened beverage intake: a randomized controlled trial1, 2, 3. Am. J. Clin. Nutr. 105, 555–563 (2017).
Carnell, S. et al. Milkshake acutely stimulates dopamine release in ventral and dorsal striatum in healthy-weight individuals and patients with severe obesity undergoing bariatric surgery: a pilot study. Nutrients 15, 2671 (2023).
Zhang, D., Hu, X., Qian, L., O’Callaghan, J. P. & Hong, J.-S. Astrogliosis in CNS pathologies: is there a role for microglia? Mol. Neurobiol. 41, 232–241 (2010).
Li, T. & Zhang, S. Microgliosis in the Injured Brain: Infiltrating Cells and Reactive Microglia Both Play a Role. The Neuroscientist 22, 165–170 (2016).
Sung, H., Park, J. M., Oh, S. U., Ha, K. & Joung, H. Consumption of ultra-processed foods increases the likelihood of having obesity in Korean women. Nutrients 13, 698 (2021).
Chang, K. et al. Association between childhood consumption of ultraprocessed food and adiposity trajectories in the avon longitudinal study of parents and children birth cohort. JAMA Pediatr 175, e211573 (2021).
Beslay, M. et al. Ultra-processed food intake in association with BMI change and risk of overweight and obesity: A prospective analysis of the French NutriNet-Santé cohort. PLOS Med 17, e1003256 (2020).
Fridén, M., Kullberg, J., Ahlström, H., Lind, L. & Rosqvist, F. Intake of ultra-processed food and ectopic-, visceral- and other fat depots: a cross-sectional study. Front. Nutr. 9, 774718 (2022).
Konieczna, J. et al. Contribution of ultra-processed foods in visceral fat deposition and other adiposity indicators: Prospective analysis nested in the PREDIMED-Plus trial. Clin. Nutr. 40, 4290–4300 (2021).
Machado, P. P. et al. Ultra-processed food consumption and obesity in the Australian adult population. Nutr. Diabetes 10, 39 (2020).
Canhada, S. L. et al. Ultra-processed foods, incident overweight and obesity, and longitudinal changes in weight and waist circumference: the Brazilian Longitudinal Study of Adult Health (ELSA-Brasil). Public Health Nutr. 23, 1076–1086 (2020).
Silva, F. M. et al. Consumption of ultra-processed food and obesity: cross sectional results from the Brazilian Longitudinal Study of Adult Health (ELSA-Brasil) cohort (2008–2010). Public Health Nutr. 21, 2271–2279 (2018).
Costa, C. S. et al. Ultra-processed food consumption and its effects on anthropometric and glucose profile: A longitudinal study during childhood. Nutr. Metab. Cardiovasc. Dis. 29, 177–184 (2019).
Delpino, F. M. et al. Ultra-processed food and risk of type 2 diabetes: a systematic review and meta-analysis of longitudinal studies. Int. J. Epidemiol. 51, 1120–1141 (2022).
Barbosa, S. S. et al. A systematic review on processed/ultra-processed foods and arterial hypertension in adults and older people. Nutrients 14, 1215 (2022).
Tan, L.-J., Hwang, S. B. & Shin, S. The longitudinal effect of ultra-processed food on the development of dyslipidemia/obesity as assessed by the NOVA system and food compass score. Mol. Nutr. Food Res. 67, 2300003 (2023).
Donat-Vargas, C. et al. High consumption of ultra-processed food is associated with incident dyslipidemia: a prospective study of older adults. J. Nutr. 151, 2390–2398 (2021).
Rauber, F., Campagnolo, P. D. B., Hoffman, D. J. & Vitolo, M. R. Consumption of ultra-processed food products and its effects on children’s lipid profiles: A longitudinal study. Nutr. Metab. Cardiovasc. Dis. 25, 116–122 (2015).
Lampe, L. et al. Visceral obesity relates to deep white matter hyperintensities via inflammation. Ann. Neurol. 85, 194–203 (2019).
García-García, I., Michaud, A., Jurado, M. Á., Dagher, A. & Morys, F. Mechanisms linking obesity and its metabolic comorbidities with cerebral grey and white matter changes. Rev. Endocr. Metab. Disord. 23, 833–843 (2022).
Lane, M. M. et al. Higher Ultra-Processed Food Consumption Is Associated with Greater High-Sensitivity C-Reactive Protein Concentration in Adults: Cross-Sectional Results from the Melbourne Collaborative Cohort Study. Nutrients 14, 3309 (2022).
Martins, G. M. et al. Intake of ultra-processed foods is associated with inflammatory markers in Brazilian adolescents. Public Health Nutr. 25, 591–599 (2022).
Santos, F. S. et al. Consumption of ultra-processed foods and interleukin-6 in two cohorts from high- and middle-income countries. Br. J. Nutr. 1–28 https://doi.org/10.1017/S0007114522000551 (2022).
Lopes, A. E. D. S. C., Araújo, L. F., Levy, R. B., Barreto, S. M. & Giatti, L. Association between consumption of ultra-processed foods and serum C-reactive protein levels: cross-sectional results from the ELSA-Brasil study. Sao Paulo Med. J. 137, 169–176 (2019).
Maki, K. A., Sack, M. N. & Hall, K. D. Ultra-processed foods: increasing the risk of inflammation and immune dysregulation? Nat. Rev. Immunol. 1–2 https://doi.org/10.1038/s41577-024-01049-x (2024).
Gearhardt, A. N. & DiFeliceantonio, A. G. Highly processed foods can be considered addictive substances based on established scientific criteria. Addiction https://doi.org/10.1111/add.16065 (2022).
Berridge, K. C., Ho, C.-Y., Richard, J. M. & DiFeliceantonio, A. G. The tempted brain eats: Pleasure and desire circuits in obesity and eating disorders. Brain Res. 1350, 43–64 (2010).
Peciña, S. & Berridge, K. C. Dopamine or opioid stimulation of nucleus accumbens similarly amplify cue-triggered ‘wanting’ for reward: entire core and medial shell mapped as substrates for PIT enhancement. Eur. J. Neurosci. 37, 1529–1540 (2013).
Kelly, A. L., Baugh, M. E., Oster, M. E. & DiFeliceantonio, A. G. The impact of caloric availability on eating behavior and ultra-processed food reward. Appetite 178, 106274 (2022).
Gutiérrez-Martos, M. et al. Cafeteria diet induces neuroplastic modifications in the nucleus accumbens mediated by microglia activation. Addict. Biol. 23, 735–749 (2018).
Nieto, A. M., Catalfio, A. M., Papacostas Quintanilla, H., Alonso-Caraballo, Y. & Ferrario, C. R. Transient effects of junk food on NAc core MSN excitability and glutamatergic transmission in obesity-prone female rats. Obesity 31, 434–445 (2023).
Oginsky, M. F. & Ferrario, C. R. Eating “junk food” has opposite effects on intrinsic excitability of nucleus accumbens core neurons in obesity-susceptible versus -resistant rats. J. Neurophysiol. 122, 1264–1273 (2019).
Rapuano, K. M. et al. Nucleus accumbens cytoarchitecture predicts weight gain in children. Proc. Natl. Acad. Sci. USA117, 26977–26984 (2020).
Rapuano, K. M. et al. Longitudinal evidence of a vicious cycle between nucleus accumbens microstructure and childhood weight gain. J. Adolesc. Health 70, 961–969 (2022).
Tweedale, M. et al. Obesity and diffusion-weighted imaging of subcortical grey matter in young and older adults. Appetite 200, 107527 (2024).
Ottenheimer, D., Richard, J. M. & Janak, P. H. Ventral pallidum encodes relative reward value earlier and more robustly than nucleus accumbens. Nat. Commun. 9, 4350 (2018).
Münte, T. F. et al. The human globus pallidus internus is sensitive to rewards – Evidence from intracerebral recordings. Brain Stimulat. 10, 657–663 (2017).
Howell, N. A. et al. Preliminary evidence for human globus pallidus pars interna neurons signaling reward and sensory stimuli. Neuroscience 328, 30–39 (2016).
Ottenheimer, D. J. et al. Reward activity in ventral pallidum tracks satiety-sensitive preference and drives choice behavior. Sci. Adv. 6, eabc9321 (2020).
Izadi, M. S. & Radahmadi, M. Overview of the central amygdala role in feeding behaviour. Br. J. Nutr. 127, 953–960 (2022).
Penzo, M. A. & Gao, C. The paraventricular nucleus of the thalamus: an integrative node underlying homeostatic behavior. Trends Neurosci. 44, 538–549 (2021).
Thaler, J. P. et al. Obesity is associated with hypothalamic injury in rodents and humans. J. Clin. Invest. 122, 153–162 (2012).
Castro, D. C., Cole, S. L. & Berridge, K. C. Lateral hypothalamus, nucleus accumbens, and ventral pallidum roles in eating and hunger: interactions between homeostatic and reward circuitry. Front. Syst. Neurosci. 9 https://doi.org/10.3389/fnsys.2015.00090 (2015).
Vainik, U., García-García, I. & Dagher, A. Uncontrolled eating: a unifying heritable trait linked with obesity, overeating, personality and the brain. Eur. J. Neurosci. 50, 2430–2445 (2019).
García-García, I. et al. Liking and left amygdala activity during food versus nonfood processing are modulated by emotional context. Cogn. Affect. Behav. Neurosci. 20, 91–102 (2020).
Choi, Y. J., Lee, E. J. & Lee, J. E. The fornix: functional anatomy, normal neuroimaging, and various pathological conditions. Investig. Magn. Reson. Imaging 25, 59 (2021).
Wiss, D. A. & LaFata, E. M. Ultra-processed foods and mental health: where do eating disorders fit into the puzzle. Nutrients 16, 1955 (2024).
Barbosa, D. A. N. et al. An orexigenic subnetwork within the human hippocampus. Nature 621, 381–388 (2023).
Astrup, A. & Monteiro, C. A. Does the concept of “ultra-processed foods” help inform dietary guidelines, beyond conventional classification systems? NO. Am. J. Clin. Nutr. https://doi.org/10.1093/ajcn/nqac123 (2022).
Monteiro, C. A. & Astrup, A. Does the concept of “ultra-processed foods” help inform dietary guidelines, beyond conventional classification systems? YES. Am. J. Clin. Nutr. https://doi.org/10.1093/ajcn/nqac122 (2022).
Acknowledgements
This research used the NeuroHub infrastructure and was undertaken thanks in part to funding from the Canada First Research Excellence Fund, awarded through the Healthy Brains, Healthy Lives initiative at McGill University. This research was enabled in part by support provided by Calcul Québec and the Digital Research Alliance of Canada. We also would like to thank Fernanda Rauber for sharing their NOVA food classifications of UK Biobank food and beverage items. This research has been conducted using the UK Biobank Resource under Application Number 45551. This work was supported by a Foundation Scheme award to AD from the Canadian Institutes of Health Research. AK was supported by funding from the Jenny and Antti Wihuri Foundation, University of Helsinki and the Finnish National Agency of Education (EDUFI). AH was supported by funding from the University of Helsinki.
Ethics declarations
Competing interests
The authors declare no competing interests.
Additional information
Publisher’s note Springer Nature remains neutral with regard to jurisdictional claims in published maps and institutional affiliations.
Supplementary information
Rights and permissions
Open Access This article is licensed under a Creative Commons Attribution-NonCommercial-NoDerivatives 4.0 International License, which permits any non-commercial use, sharing, distribution and reproduction in any medium or format, as long as you give appropriate credit to the original author(s) and the source, provide a link to the Creative Commons licence, and indicate if you modified the licensed material. You do not have permission under this licence to share adapted material derived from this article or parts of it. The images or other third party material in this article are included in the article’s Creative Commons licence, unless indicated otherwise in a credit line to the material. If material is not included in the article’s Creative Commons licence and your intended use is not permitted by statutory regulation or exceeds the permitted use, you will need to obtain permission directly from the copyright holder. To view a copy of this licence, visit http://creativecommons.org/licenses/by-nc-nd/4.0/.
About this article
Cite this article
Morys, F., Kanyamibwa, A., Fängström, D. et al. Ultra-processed food consumption affects structural integrity of feeding-related brain regions independent of and via adiposity. npj Metab Health Dis 3, 13 (2025). https://doi.org/10.1038/s44324-025-00056-3
Received: 05 September 2024
Accepted: 27 February 2025
Published: 08 April 2025
DOI: https://doi.org/10.1038/s44324-025-00056-3

![Software Engineering's Greatest Hits [video]](https://www.youtube.com/img/desktop/supported_browsers/firefox.png)

