.png)

|
A column on various things Internet |
|
|
Other Formats:
|
|
|
|
|
How we Measure: IPv6
November 2025
At APNIC Labs we publish a number of measurements of the deployment of various technologies that are being adopted on the Internet. Here I will look at how we measure the adoption of IPv6.
IPv6
By 1990 it was clear that IP had a problem. It was still a tiny Internet at the time, but the growth patterns were exponential, doubling in size every 12 months. We were stressing out the pool of Class B IPv4 addresses and in the absence of any corrective measures this address pool would be fully depleted in 1994.
The short-term expedient response from the Internet Engineering Task Force (IETF) was to drop the Class structure in the IP address architecture and allow networks to use an address prefix length more precisely suited to each network. Routing protocols, including BGP, were quickly modified to support these classless address prefixes. Variably sized address prefixes added additional burdens to the address allocation process, and in the medium term the Internet community adopted the organisational measure of the Regional Internet Registry structure to allow each region to resource the increasingly detailed operation of address allocation and registry functions for their region. These measures increased the specificity of address allocations and provided the allocation process with a more exact alignment to determine adequate resource allocations that permitted a more diligent application of relatively conservative address allocation practices. These measures realized a significant increase in address utilization efficiency. The concept of “address sharing” using Network Address Translation (NATs) also gained some traction in the ISP word. Not only did this dramatically simplify the address administration processes in ISPs, NATs also played a major role in reducing the pressures on overall address consumption.
The adoption of these measures across the early 1990’s pushed a two-year imminent crisis into a more manageable decade-long scenario of depletion. However, they were not considered to be a stable long-term response. It was thought at the time that an effective long-term response really needed to extend the 32-bt address field used in IPv4. At the time the transition from mainframe to laptop was well underway in the computing world and the prospect of further reductions in size and expansion of deployment in smaller embedded devices was clear at the time. An address space of 4 billion was just not large enough for what was likely to occur in the coming years in the computing world.
After some debate, the IETF decided in 1994 to change as little as possible in IP except the size of the address fields. The address fields in the IP packet headers were expanded to 128 bits, a Flow ID field was introduced, fragmentation behaviour was altered and pushed into an optional header and ARP was replaced with multicast.
The bottom line was that IPv6 did not offer any new functionality that was not already present in IPv4. It did not introduce any significant changes to the operation of IP. It was just IP, with larger addresses.
However, those minimal changes were enough to ensure that IPv6 was not backward compatible with IPv4. A host with an IPv4 network protocol suite cannot directly communicate with an IPv6-only host. That implies that the transition to an IPv6 network involves two steps. The first is to equip all hosts and all network infrastructure needs to be capable of support both IPv4 and IPv6 protocols simultaneously, or dual stack. Only when then entire collection of hosts and networks have completed this first step will it be feasible to drop support for IPv4 from the network. This latter phase could be achieved quickly once the entire network supports both protocol stacks. However, the first step, to a dual stack environment was never through to be one that would be completed quickly, but few were predicting that we would still be in the middle of this dual stack transition some 30 years later.
Measuring IPv6 Deployment
The question we'd like an answer to: "How much longer will this transition to universal dual stack support take?" This is a question that is more easily answered by using a slightly different formulation of the question: "What proportion of users support the use of IPv6?"
The reason why this is an equivalent question is that if we can measure the level of IPv6 deployment then this measurement is equivalent to the measurement of dual stack support. A time series of this measurement can be used to formulate a predictive model, which can provide an answer to the question of how much longer will this process take.
Measurement by Advertisements
APNIC Labs uses online advertisements to perform such measurements. The advertisement material includes a script component which is executed by the user's browser when the ad is impressed. The script’s functional capabilities are highly limited in the context of ads, but they do permit the script to perform the retrieval of URLs. A URL requires resolution of a DNS name and then an HTTP operation to fetch the identified resource. The DNS name used in these ads is unique, in that each measurement test in each impressed ad uses a different DNS label. This is to remove the interference from caches in the operation of the measurement.
The measurement system is configured to present between 25M to 30M ad impressions per day. The ad impression pattern across the Internet is not uniform, so we use additional data from the UN Statistics Division and the ITU-T to relate the number of ad impressions per country per day to the Internet user count per country per day. The per-country ad data is weighted by the relative user count per country to adjust for this implicit ad presentation bias.
We cannot instrument the user's browser, so we set up a known set of URL fetches to be performed by the client and configure the URLs such that the tested client browser has to resolve a DNS name and perform a web fetch. We can infer the behaviour of the tested client by looking at the DNS queries and web fetch logs that are generated on our servers. We also perform a full packet capture and can analyse this to establish the round trip time and calculate the difference between IPv4 and IPv6 round trip times.
We are also interested in the behaviour of the tested client with the dual stack test. A browser that supports the Happy Eyeballs mechanism should prefer to use IPv6 when the access times to the server are comparable in both protocols.
IPv6 Deployment Reports
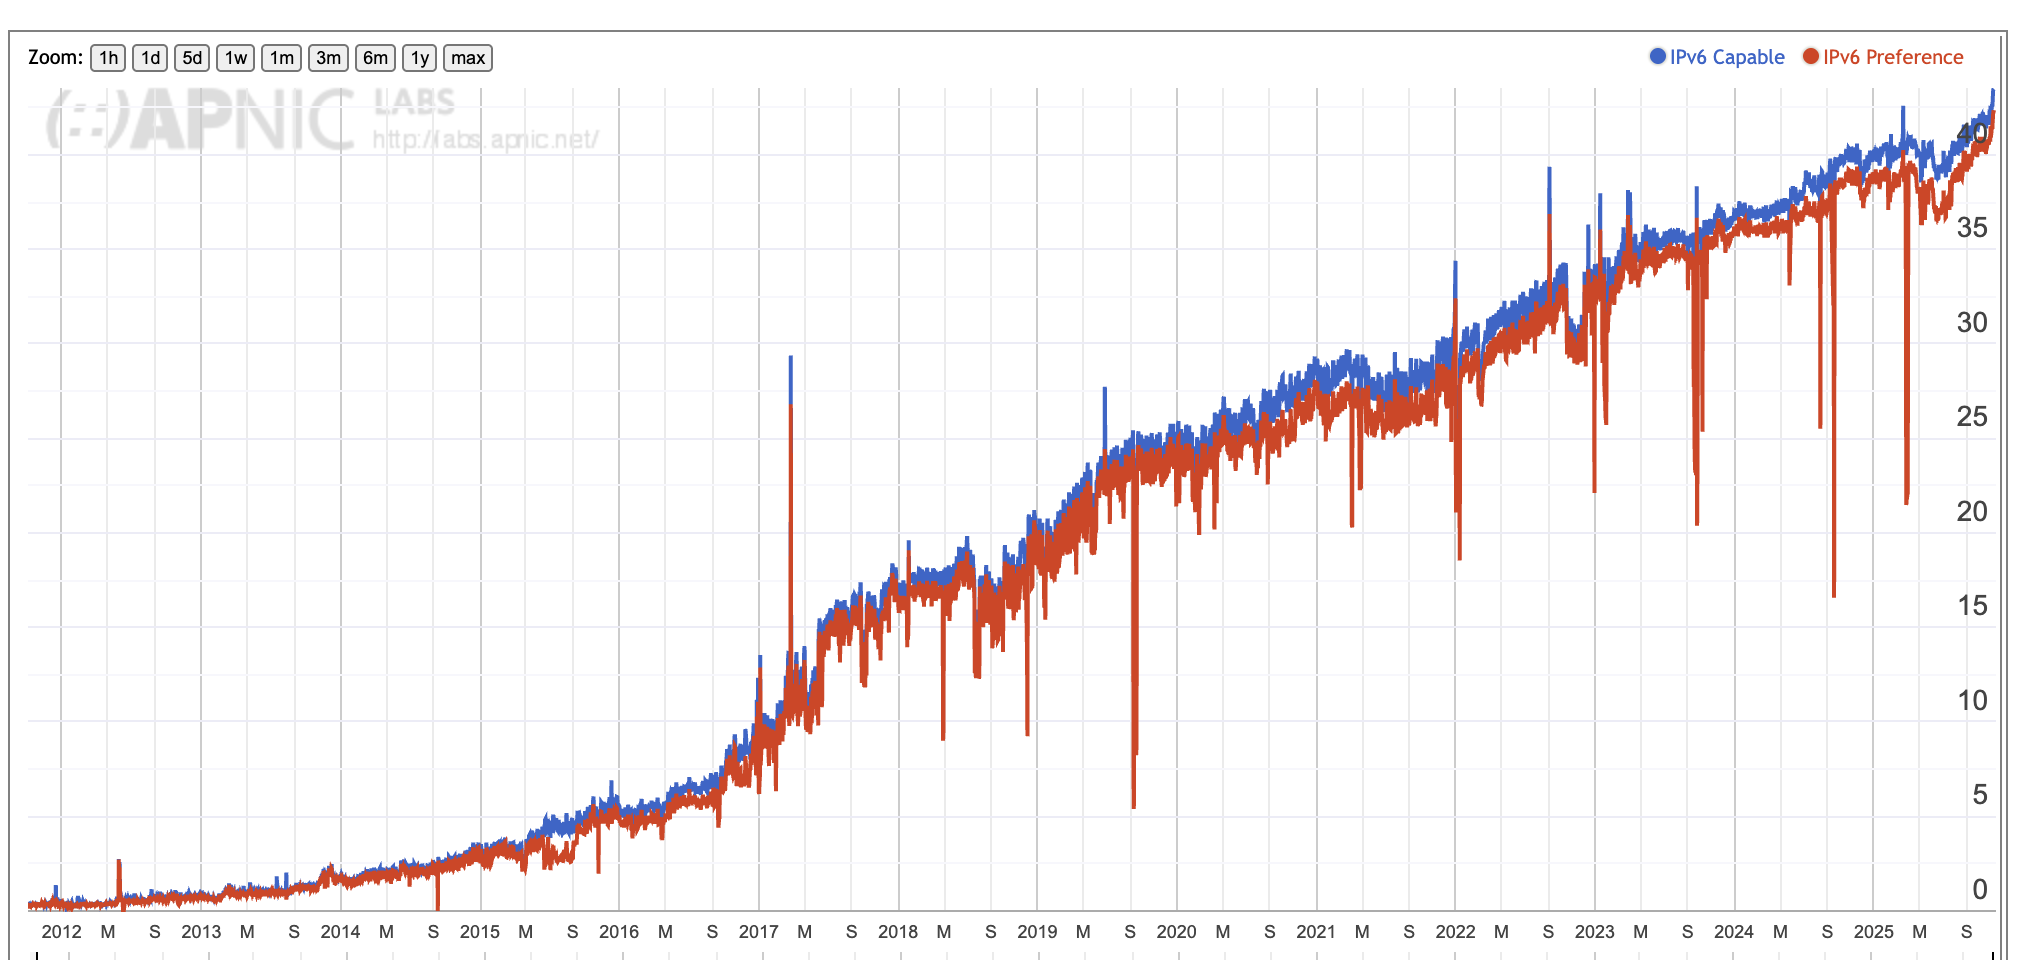
At APNIC Labs we've been undertaking this measurement on a daily basis since 2012. The overall results of the adoption of IPv6 as a time series plot of daily measurements are shown in Figure 1.
There are two time series plots in this figure. The blue trace shows the proportion of tested end users that can retrieve the IPv6-only web object, indicating that they have IPv6 capability. The second trace is the proportion of users who use IPv6 to retrieve the dual-stack web object using IPv6. There are times when a dual-stack capable host uses IPv4 in preference to IPv6 to fetch a web object. The most commonly used procedure to select which protocol to use is termed “Happy Eyeballs”, and it relies on the relative timing to resolve the DNS name of the web object into an IPv4 and an IPv6 addresses. The “happy eyeballs” host uses the protocol whose DNS resolution completes the fastest, but biases the test by giving the IPV6 resolution task a head start, generally set to 50ms. In out case the DNS and Web objects are all located in the same servers, so the only major difference is the network oath used by the two protocols. If they differ such that the IPv6 path is slower than the IPv4 path, then the likelihood that the IPv6-capable host will select IPv4 to retrieve the dual stack web object increases.
- IPv6 Update – Daily Counts from 2012 to present – https://stats.labs.apnic.net/ipv6/XA
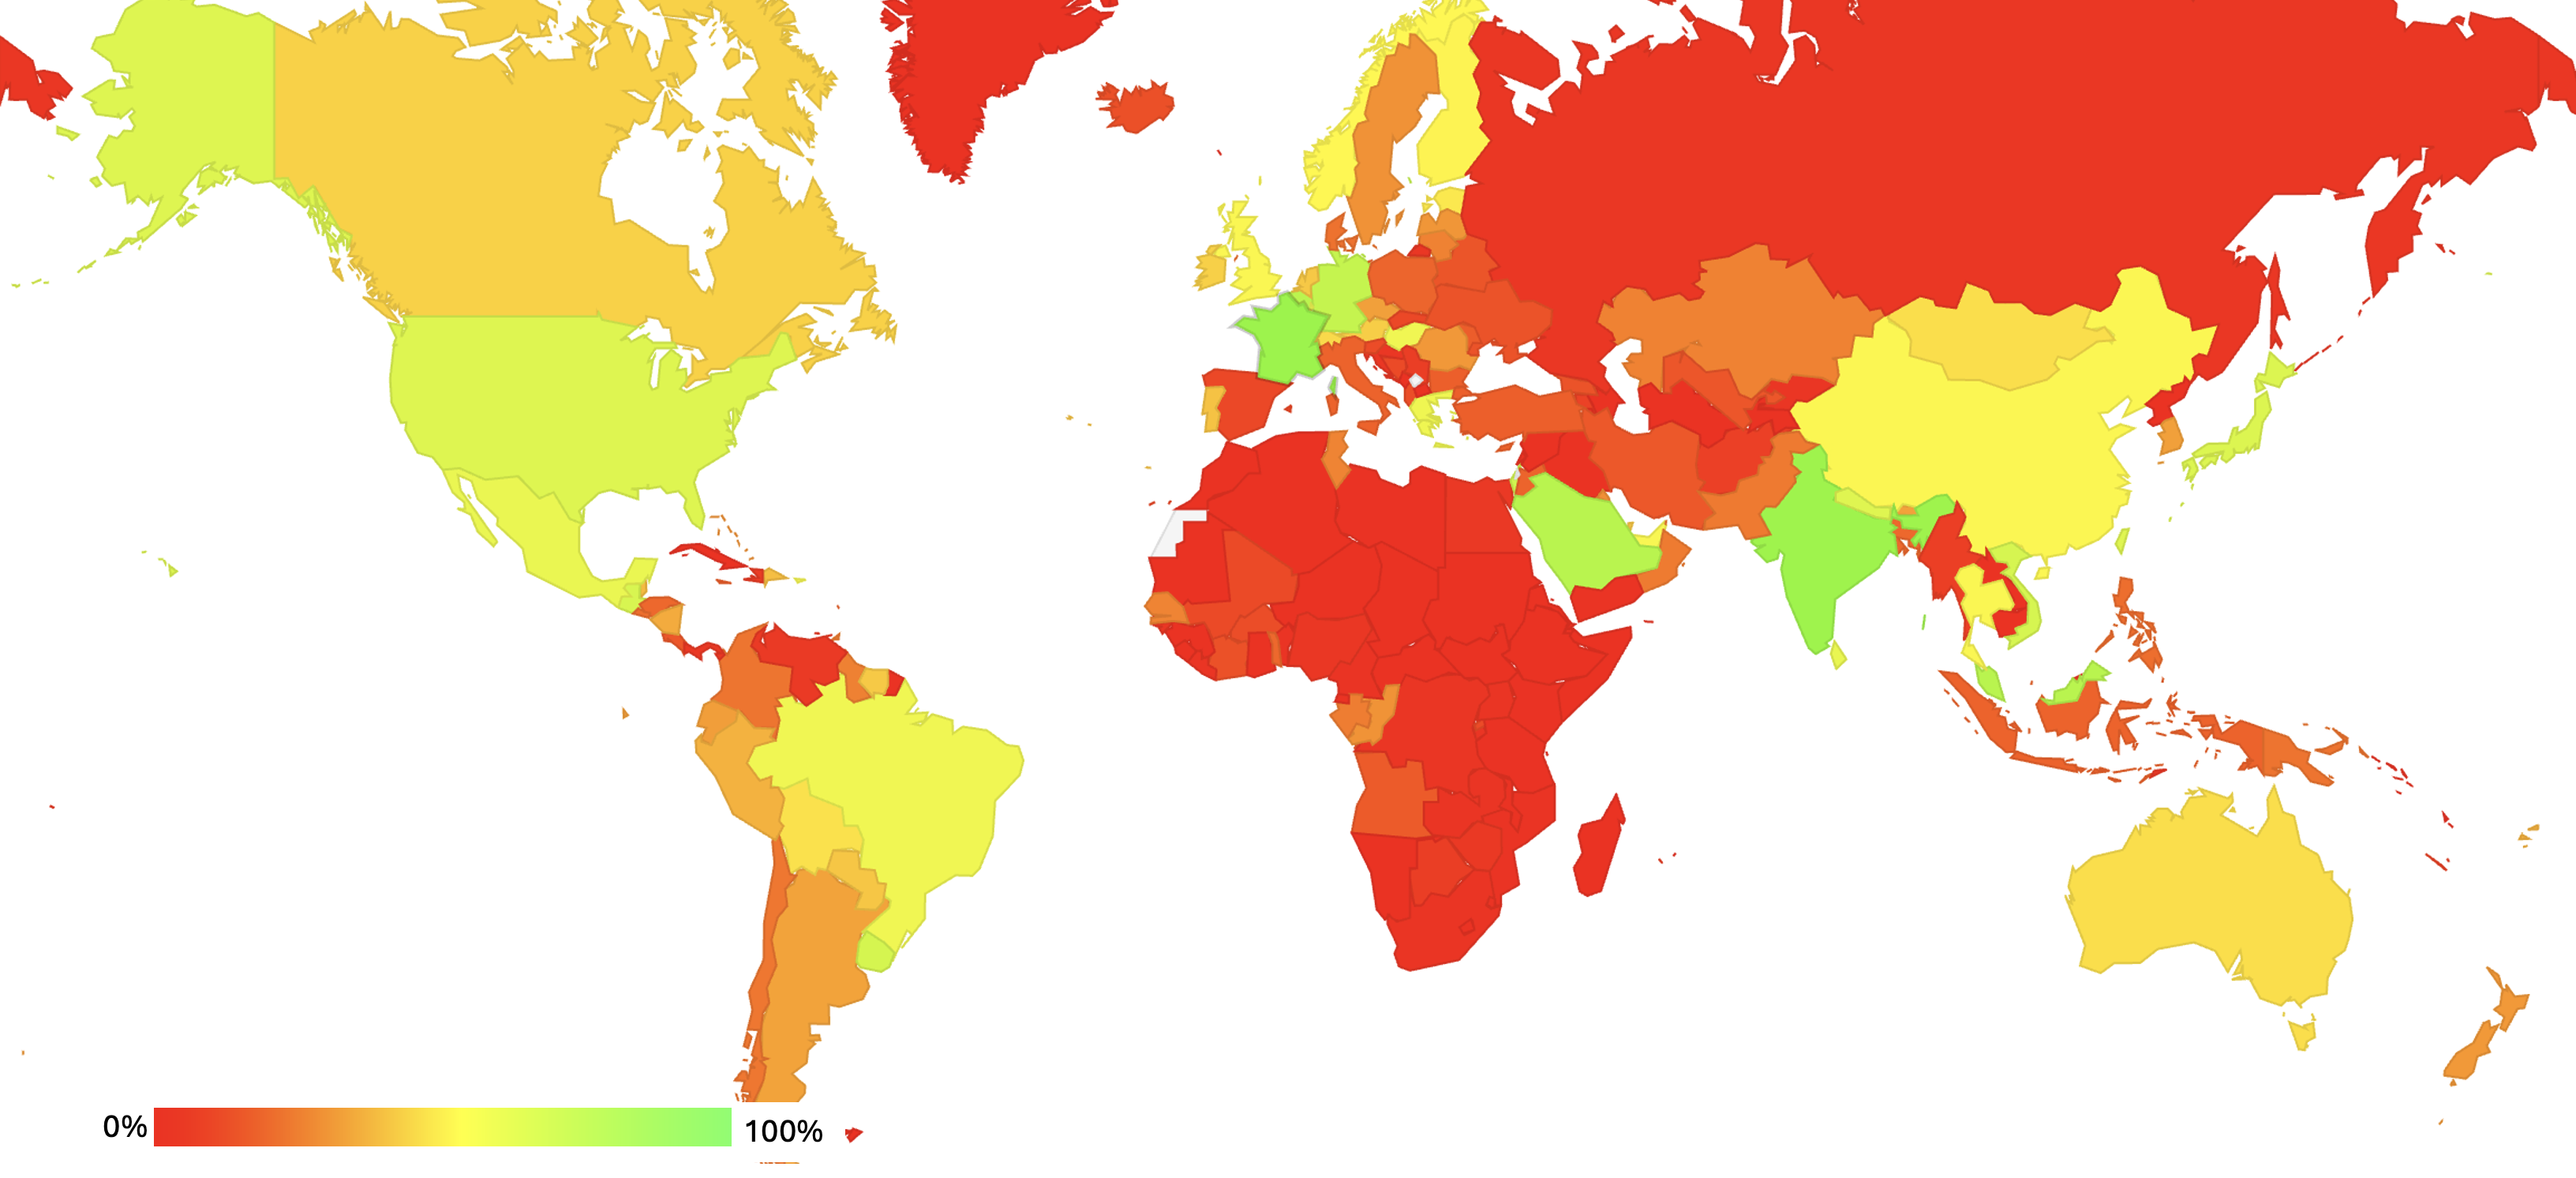
IPv6 uptake rates on a per country basis are highest in France, India and Saudi Arabia. Across most of the Africa continent, Eastern Europe and Western Asia the IPv6 adoption rates remain quite low
- Per-Country map of IPv6 Update – https://stats.labs.apnic.net/ipv6
The reports at https://stats.labs.apnic.net/ipv6 provide an interactive form of navigation that generates time series DNSSEC validation reports down to the level of individual network providers in each country.
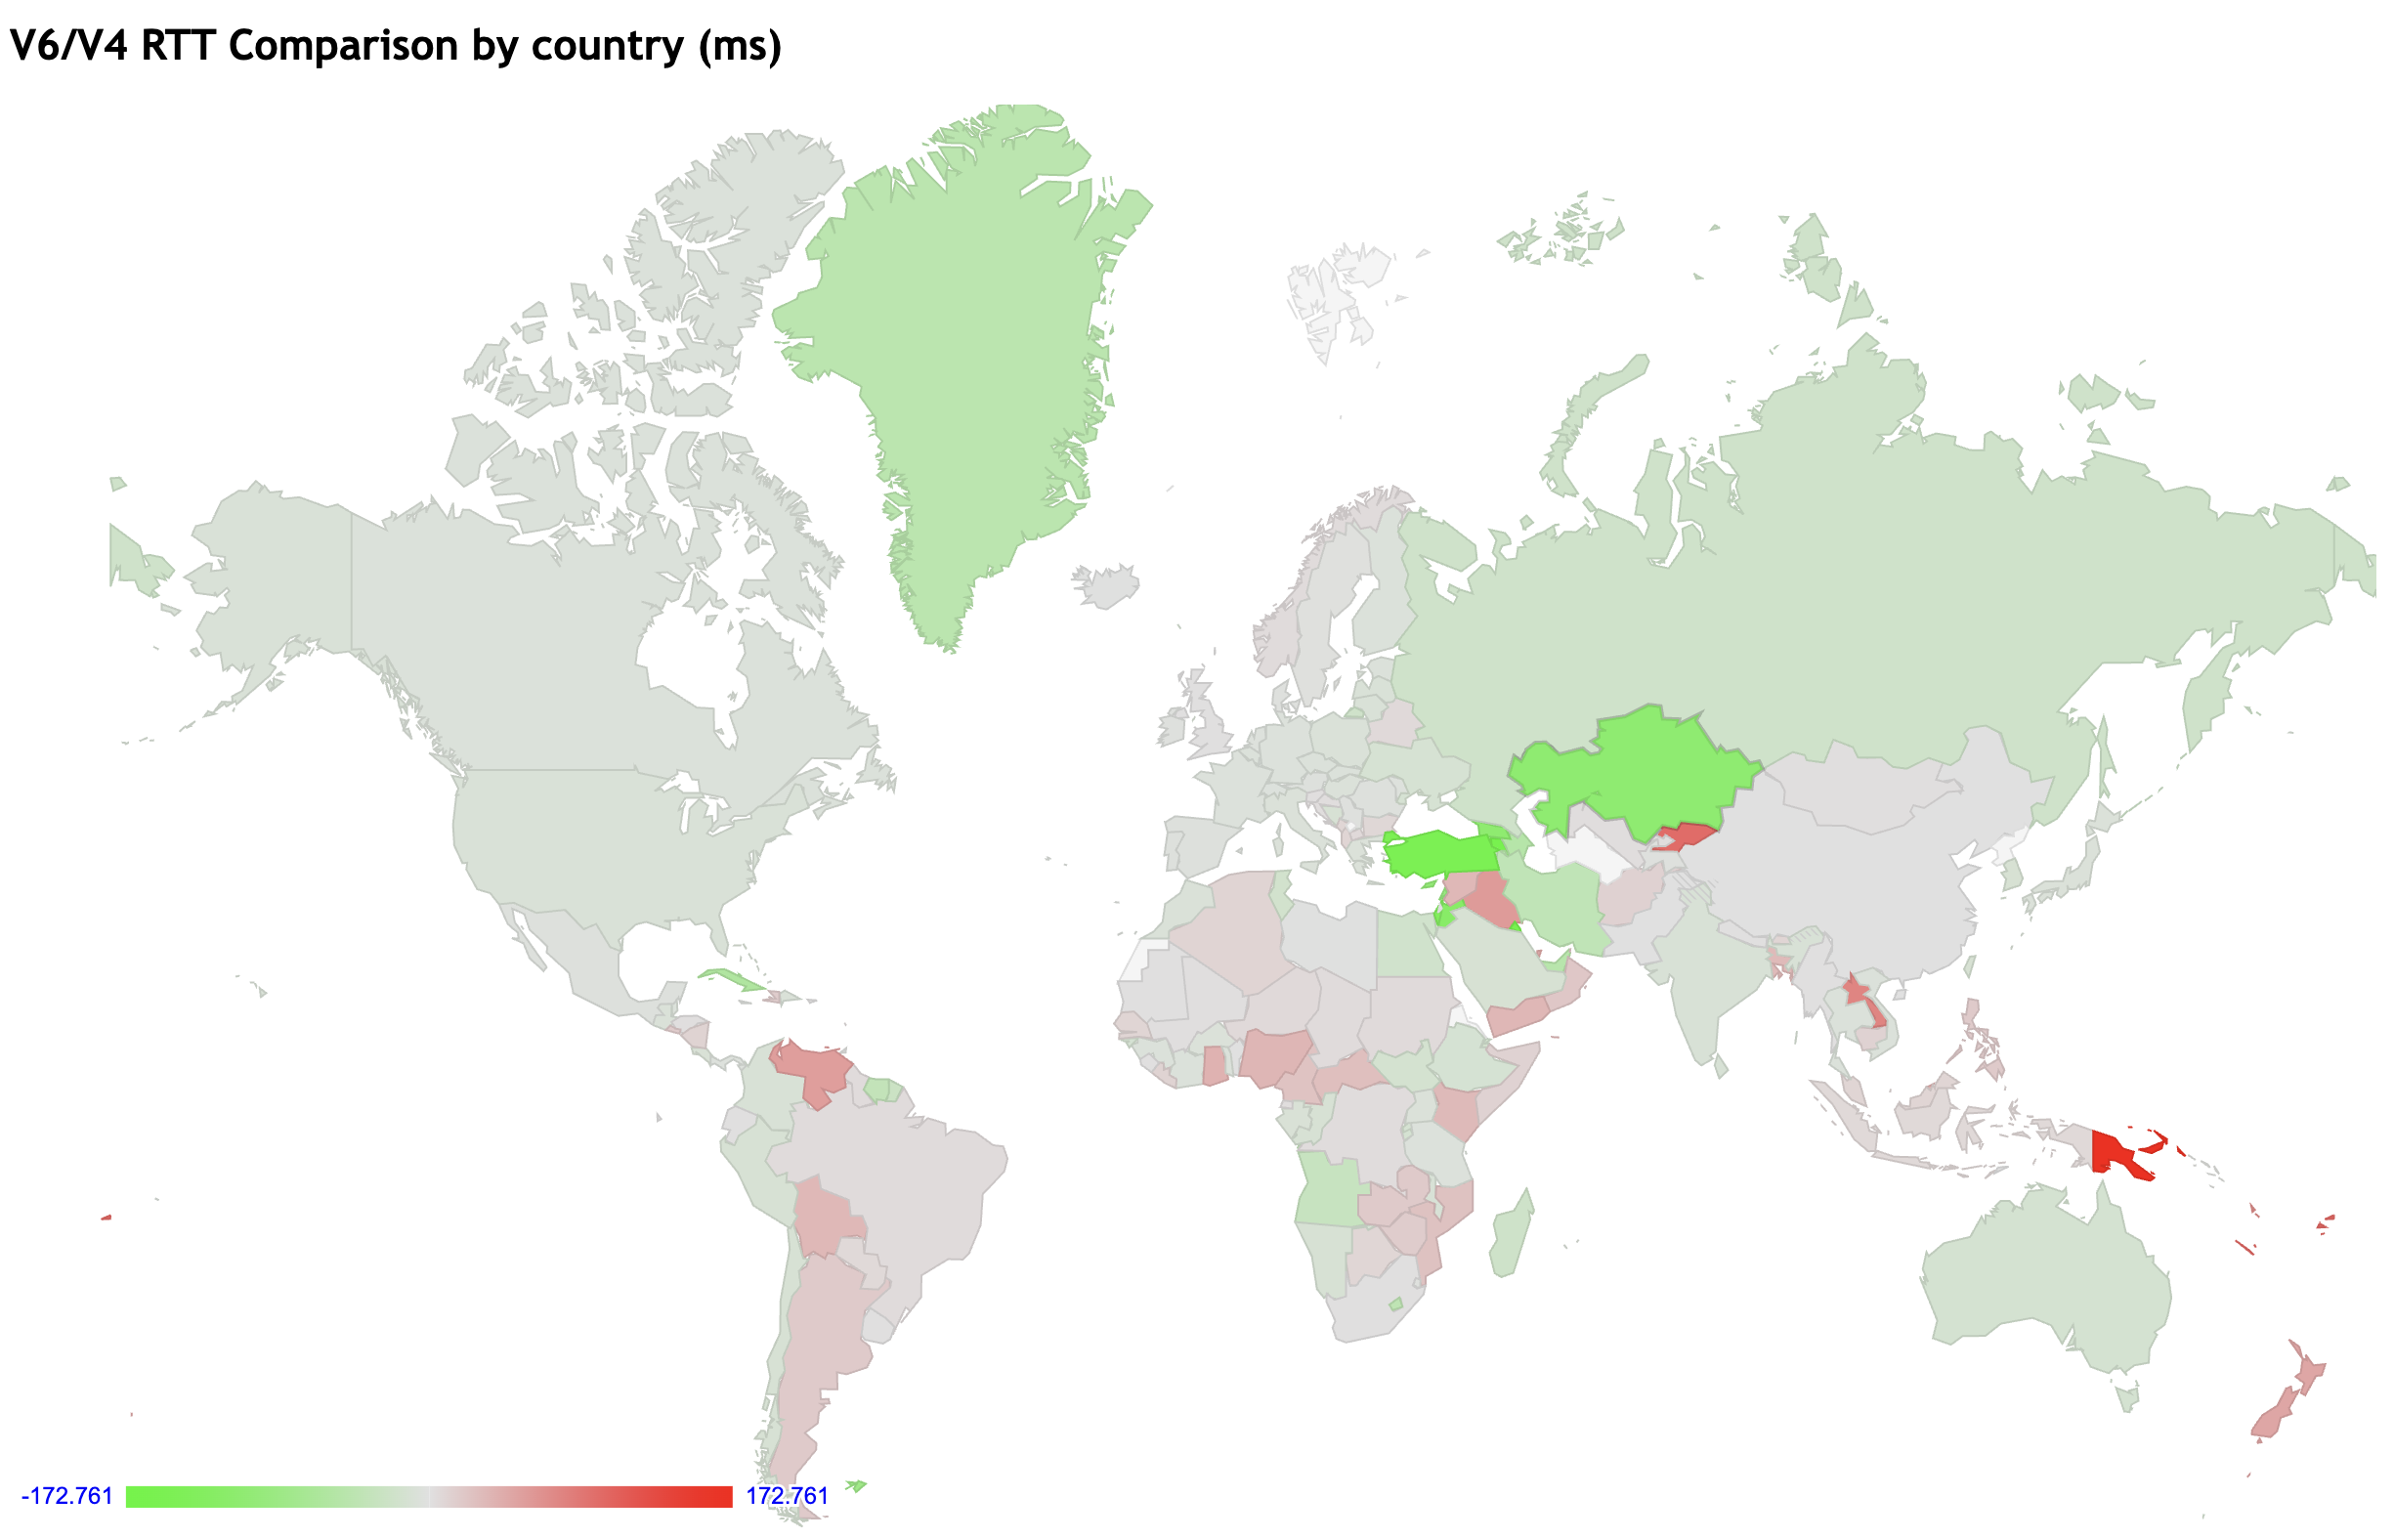
This measurement also looks at the timing of the initial TCP packet exchange (the SYN/ACK 3-way handshake) and performs a server-side measurement of the round trip time (RTT) to send a packet from the server to the client and back again. The IPv6 test also includes an IPv4-only web object in addition to the IPv6-only web object, so for dual stack hosts we will have an RTT measurement in IPv4 and in IPv6.
Because the round-trip time is a critical factor in overall service performance, we have used this RTT difference data to generate per-country view of RTT differences, shown in Figure 3.
- Per-Country map of RTT variance between IPv4 and IPv6 – https://stats.labs.apnic.net/v6perf
As indicated in this map, across much of the world there are only small differences between the RTT for these two protocols, which some notable exceptions in South America, Western Asia and Oceania
One of the changes in the IPv6 protocol, as compared to IPv4, is the handling of packet fragmentation. If a packet in transit through the network is too large to be forwarded to the next hop, the default IPv4 behaviour is to have the router break the packet into smaller fragments, using the IPv4 packet header fields to indicate that the packet has been split into smaller fragments, and the relative position of this fragment in the original unfragmented packet. These fragments are forwarded to the destination, and it is left to the destination host to reassemble these fragments into the original packet. This has proved to be incredibly useful in constructing an Internet on top of a large diversity of packet carriage technologies, and it’s also useful in supporting various forms of packet-in-packet encapsulation tunnels. IPv6 changed this behaviour and does not permit this fragmentation-on-the-fly by IPv6 routers. When a packet is too large an ICMP6 Packet-Too-Big packet has to be passed back to the sender’s address and it is up to the sender to perform packet fragmentation at the source and re-send the original packets with a fragmentation extension header added to each of these packet fragments.
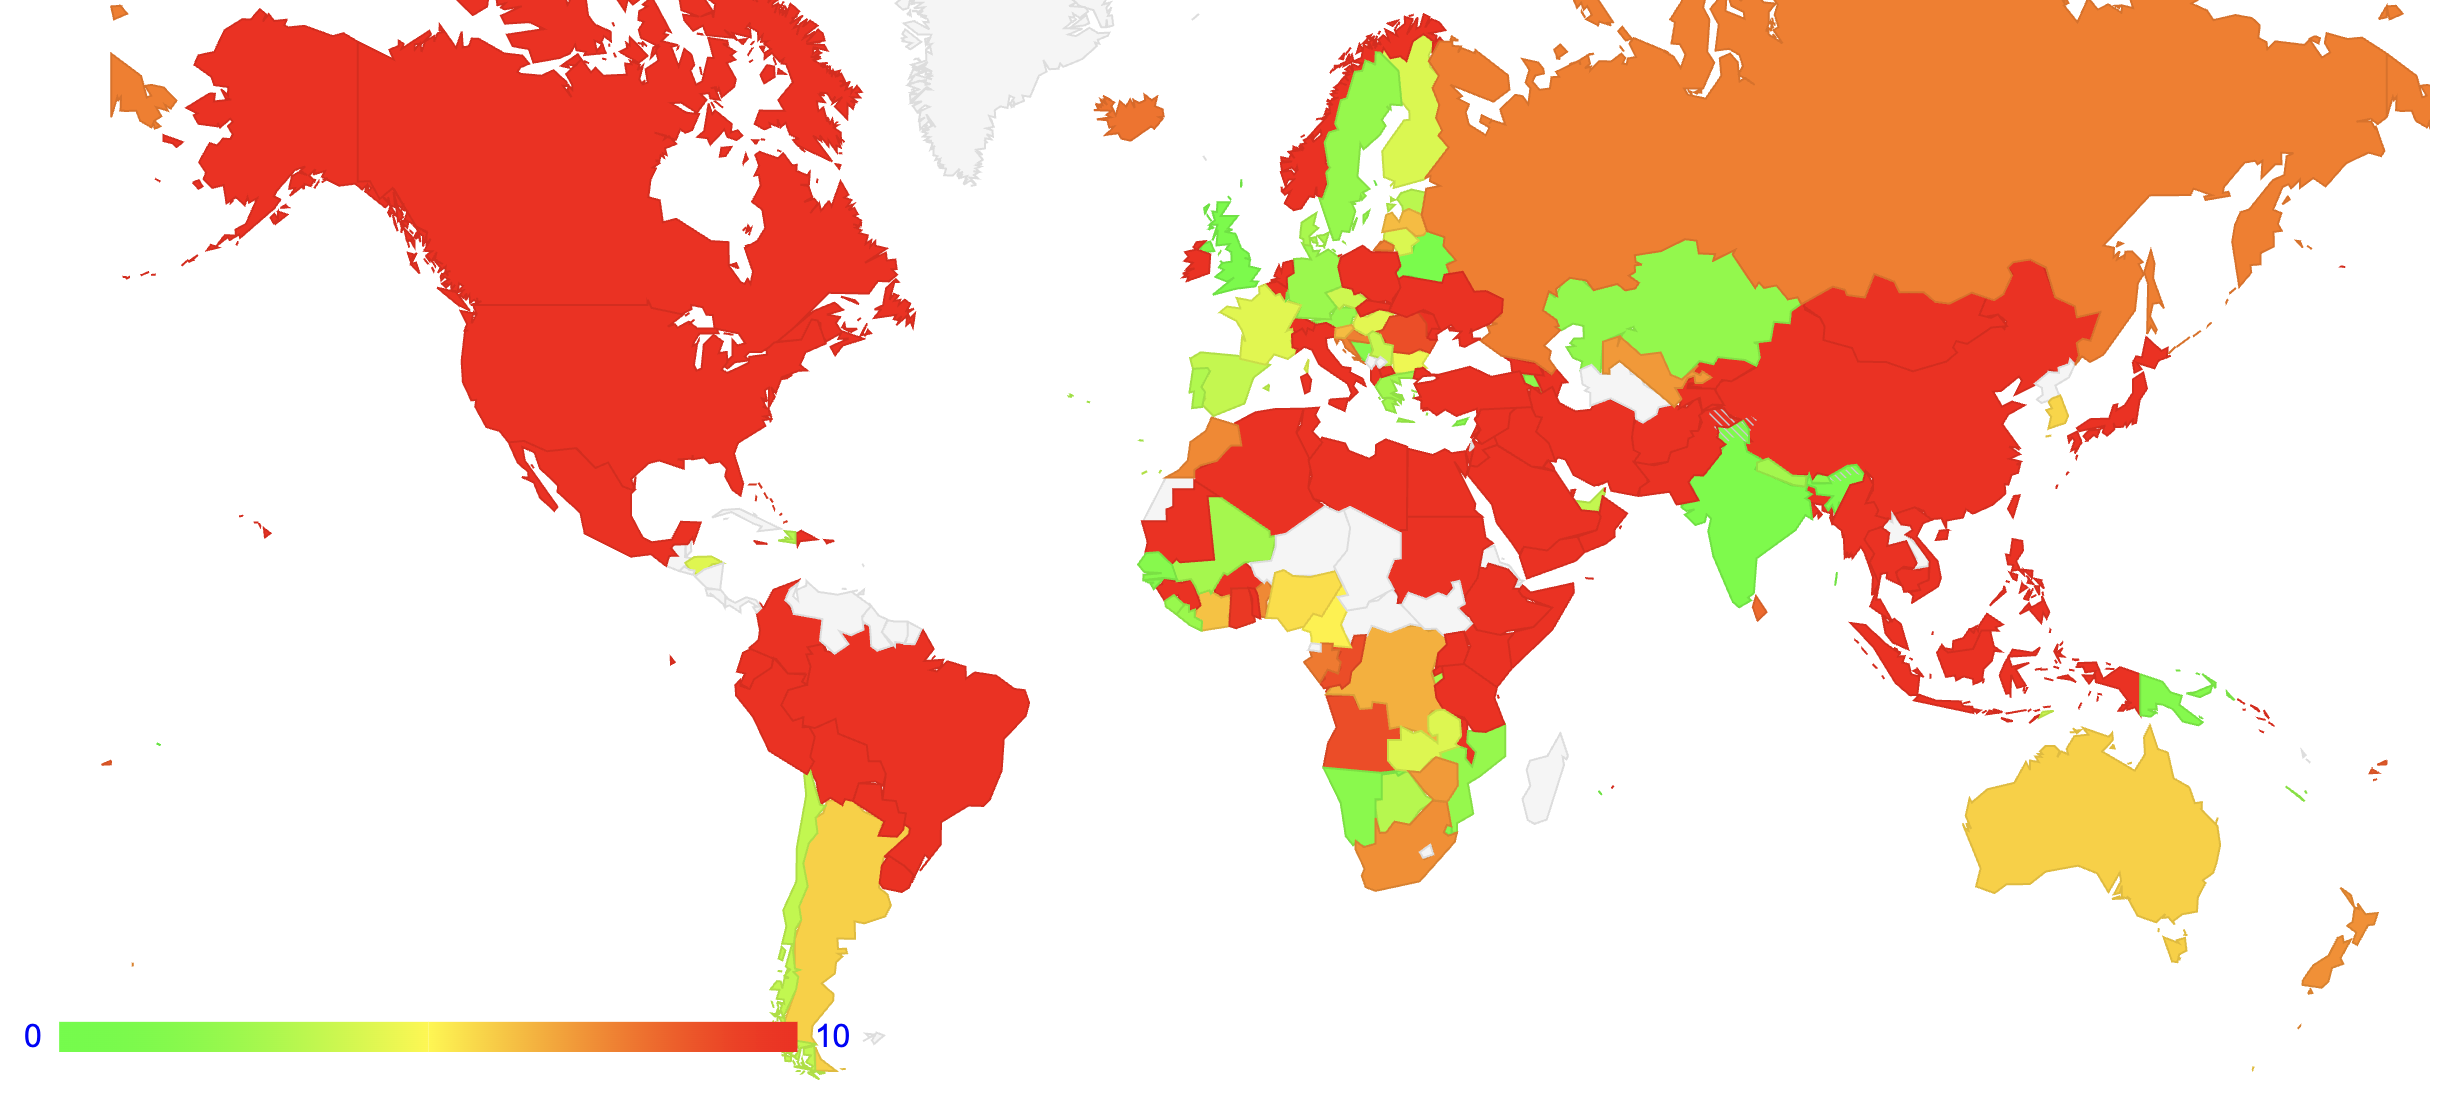
We test IPv6 fragmentation behaviour as part of the IPv6 measurement set, and a map of IPv6 fragmentation drop rates on a country basis is generated on a daily basis. The current map is shown in Figure 4.
Getting IPv6 fragmentation handled correctly in networks is evidently quite challenging. Ore recent IPv6 deployments appear to handle fragmentation far more successfully than more mature IPv6 deployments. For example, the IPv6 Fragmentation packet drop rate in Japan is an average of 20% of all users, while the same measurement in India has a far smaller 1% drop rate. But this is not always the case, and the IPv6 fragmentation drop rate in China, where the IPv6 deployment is currently underway, has a massive 76% drop rate. There is an opinion that this drop rate of IPv6 fragmented packets will decline over time, and a diametrically opposed opinion that this is an intractable problem and the onus is on end host behaviours to always use packets that are sized below the IPv6 maximum unfragmented packet size of 1,280 octets.
- Per-Country map of IPv6 fragmentation drop rates – https://stats.labs.apnic.net/v6frag
The Outlook for IPv6
Much has been said on the outlook for IPv6, and I have added my own share of the word count on this topic (such as this article from October 2024).
As Figure 2 indicates, the IPv6 map shows a very fragmented picture. Many of the countries with a well-developed and mature Internet infrastructure with high GDP per capita have made progress with IPv6, but there are also some notable exceptions, such as India, which has made major steps with a high volume IPv6 deployment in a national economy that has a low GDP per capita.
The IPv6 deployment in Africa, the Middle East and Eastern Europe is generally very low, and if we want to see the overall IPv6 deployment measurement lift above 50% then much needs to be done on IPv6 deployment in these regions of our world. There are significant challenges that need to be overcome along this path, and its perhaps best not to be too impatient in waiting to see the IPv6 deployment measurement lift up to a level that shows a comprehensive adoption of a IPv6-capable Internet.
![]()
Disclaimer
The above views do not necessarily represent the views of the Asia Pacific Network Information Centre.
The author was one of two liaisons from the IETF to the RSS GWG. The views expressed here are his personal views and are not endorsed by anyone else!
![]()
About the Author
GEOFF HUSTON AM, M.Sc., is the Chief Scientist at APNIC, the Regional Internet Registry serving the Asia Pacific region.


