.png)

We're building Dolt, the world's first and only version-controlled SQL database. We're using Go, and have been very happy with the Go team's thoughtful and careful approach to rolling out new language features and improvements. Gradual improvements in the Go compiler and runtime means that Dolt has slowly gotten faster over time without any work on our part, and profiler-guided optimizations (PGO) won us 5% read latency improvements with very little work on our end.
So when we heard about Go's new, experimental Green Tea garbage collector, we were excited to see what new performance gains it would provide the database. From the Go team:
On average 85% of the garbage collector's time is spent in the core loop of this graph flood—the scan loop—and >35% of CPU cycles in the scan loop are spent solely stalled on memory accesses, excluding any knock-on effects. This problem is expected to only get worse as the industry trends toward many-core systems and non-uniform memory architectures.
In this document, we present Green Tea: a parallel marking algorithm that, if not memory-centric, is at least memory-aware, in that it endeavors to process objects close to one another together.
So this new garbage collector attempts to scan objects relative to their location in memory, improving cache locality and resulting in greater throughput. Neat!
But they caution that their own benchmarks indicate most real-world programs don't see much difference in performance.
The results are positive overall, but include a mix of improvements and regressions.
Most benchmarks were either unaffected by the changes to the garbage collector or regressed or improved solely due to changes that had little to do with the garbage collector, such as code alignment changes. Some benchmarks regressed even though less CPU time is spent in the garbage collector. One reason for this is because the garbage collector's mark phase is active for less time, leading to less floating garbage which acts as a ballast in some benchmarks. Another reason for this is that less time spent in the garbage collector means more time spent in other scalability bottlenecks, either in the runtime or in user code, leading to a net apparent regression.
So would Dolt be the rare application that saw a big speed up from Green Tea? Spoiler: no.
You can turn on Green Tea at build time with the GOEXPERIMENT=greenteagc environment var. For us, this looks like building two binaries, one with Green Tea enabled and one without. You need Go 1.25 for this to work.
So now we have a vanilla build with the classic garbage collector, and one with Green Tea. Now we just start the database server like so:
We did this one at a time, then ran our standard latency benchmarking program, sysbench, against each of the running servers.
The oltp_read_write bench suite is a pretty fair simulation of a real database workload, so it's a good candidate for seeing if there's any difference in performance. And the --histogram=on option collects a histogram of latency measurements, so we can see if the shape of the latency distribution changes in addition to just its median / tail.
Without Green Tea enabled, the performance numbers look like this:
With Green Tea enabled, it's essentially identical. Small differences in the min and max latencies recorded, but no change in throughput or median latency.
When we plot the histogram of latency measurements, this is what we see:
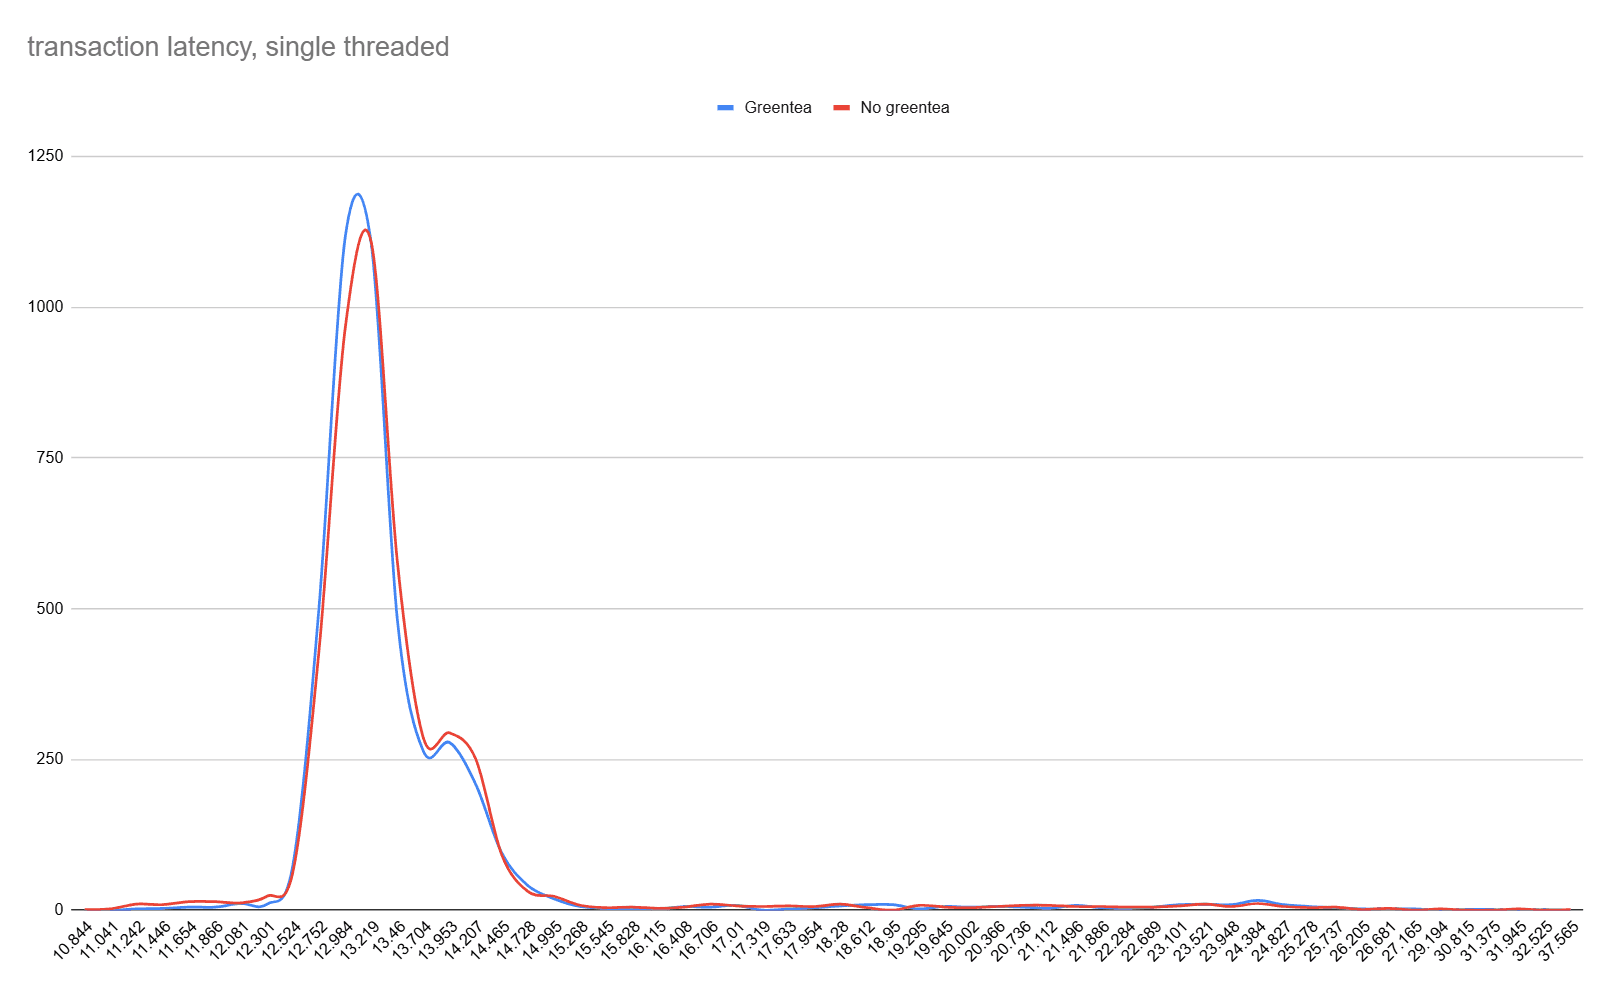
So not only are the median latency and throughput (measured in transactions per second) almost identical between the two binaries, but the overall latency distribution is basically the same. Zooming in at the tail end of the distribution doesn't reveal any consistent advantage in tail latency for Green Tea (which might be the case if it made garbage collection pauses shorter), it just looks like random noise.
Well that's disappointing, but it is in line with the Go team's guidance.
But wait, the garbage collector is concurrent, and our test above uses only a single worker thread. Maybe to see a real difference, we would need to throw a lot more worker threads at the server.
So we tried again, limiting Go to 8 cores and increasing the number of sysbench threads to 20. We also bumped the runtime of the benchmark to 10 minutes to collect more data points.
Here's the two latency distributions from this setup.
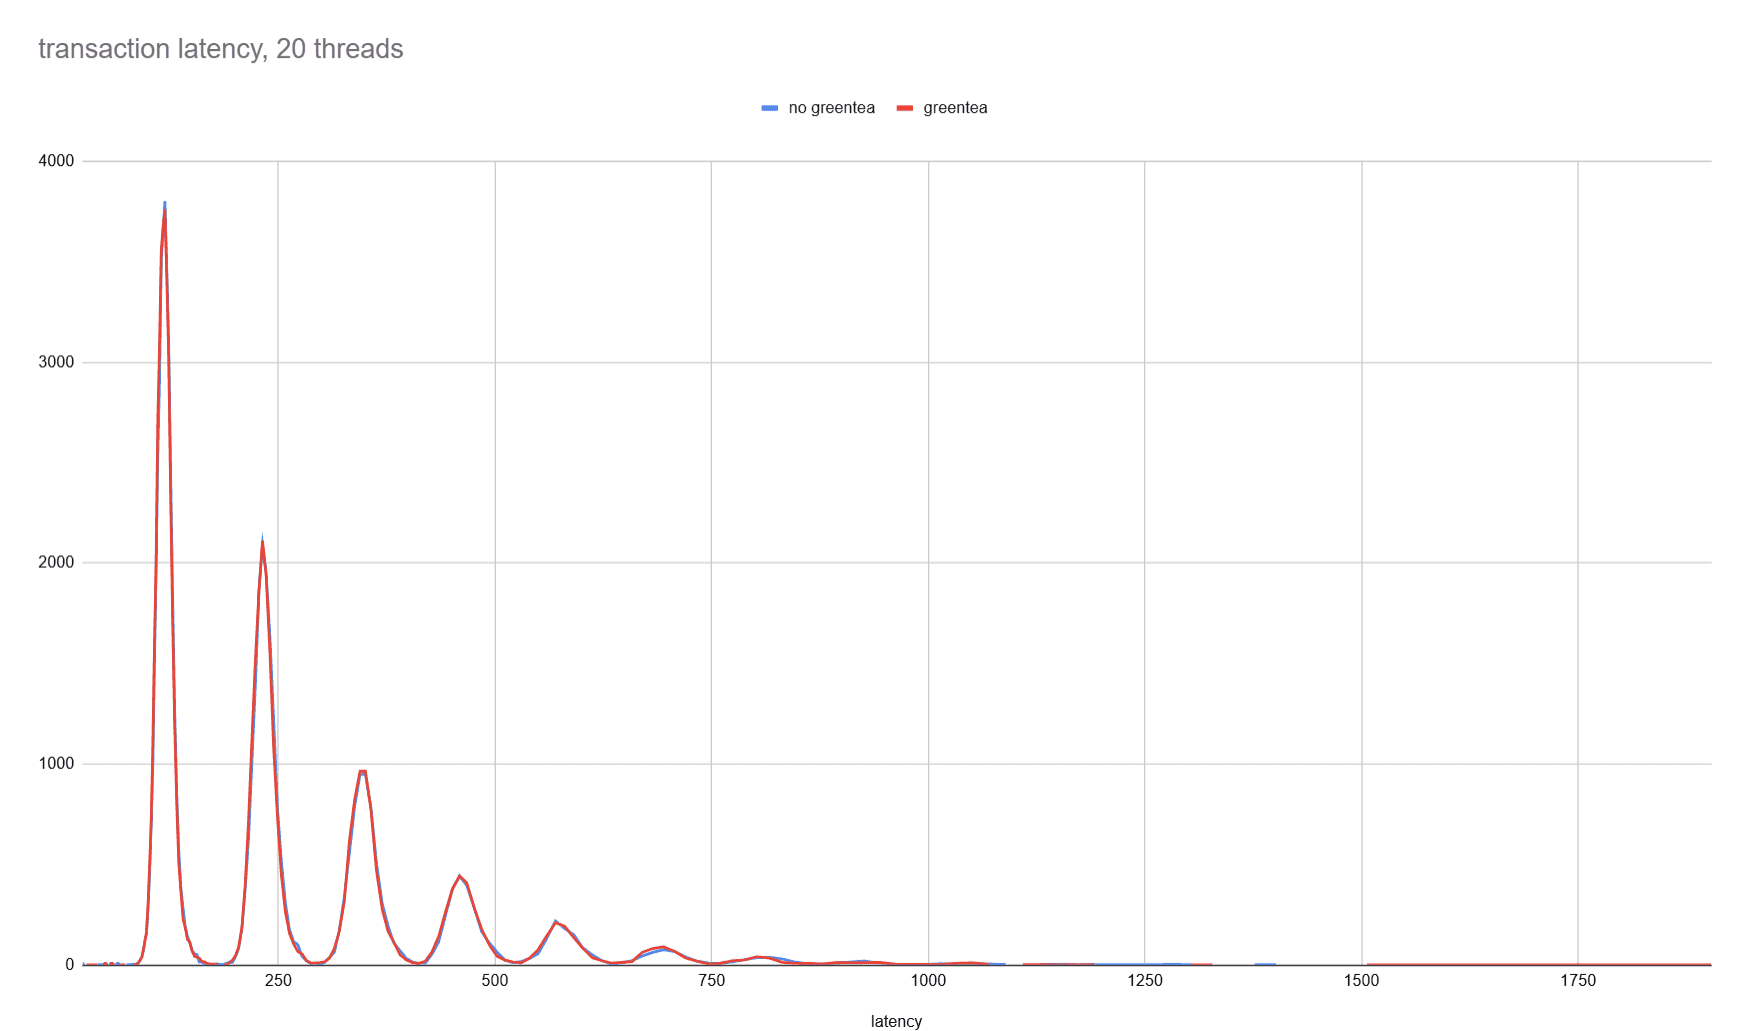
Again, identical latency distributions. If you zoom in and squint at the tail latencies, you can maybe imagine that they are a bit worse for the Green Tea collector, but it could easily just be noise. We would need to do a more thorough investigation and a better statistical analysis than eyeballing it to make a claim that it matters. (Also note that the various bumps in the distribution correspond to write contention, and essentially represent the percentage of transactions that needed to retry zero times, once, twice, etc.)
So does Green Tea do anything different, at all? To answer that, we also enabled the GODEBUG=gctrace=1 environment variable, which causes the Go runtime to emit a debug line to STDERR every time the garbage collector runs. Those lines look like this:
There's a lot going on here, but the numbers we care about are ms clock and ms cpu. These notations take a bit of research to understand, but they correspond to how the garbage collector is spending its time. For example, the clock time has three components separated by +:
- The stop-the-world pause at the end of sweep
- The concurrent mark time
- The stop-the-world pause at the end of mark
The CPU time is similar, except it further breaks out how much CPU time the mark process spent in each of several phases.
We can slice these files up for analysis with a little shell magic. For example, here's how you can extract a list of the stop-the-world pause times after the sweep phase:
Doing this for each of the metrics for each of the two binaries lets us compare their garbage collection times side by side. These are all histogram distributions of latency.
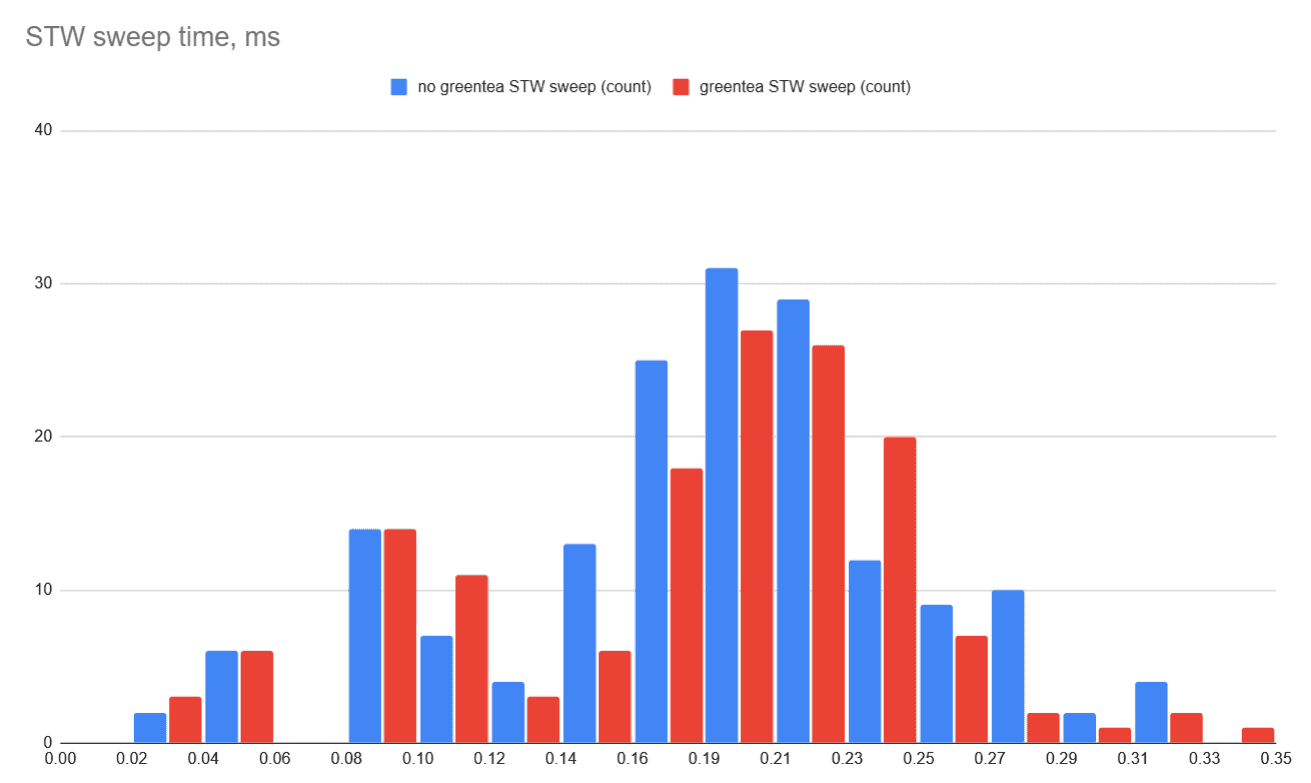
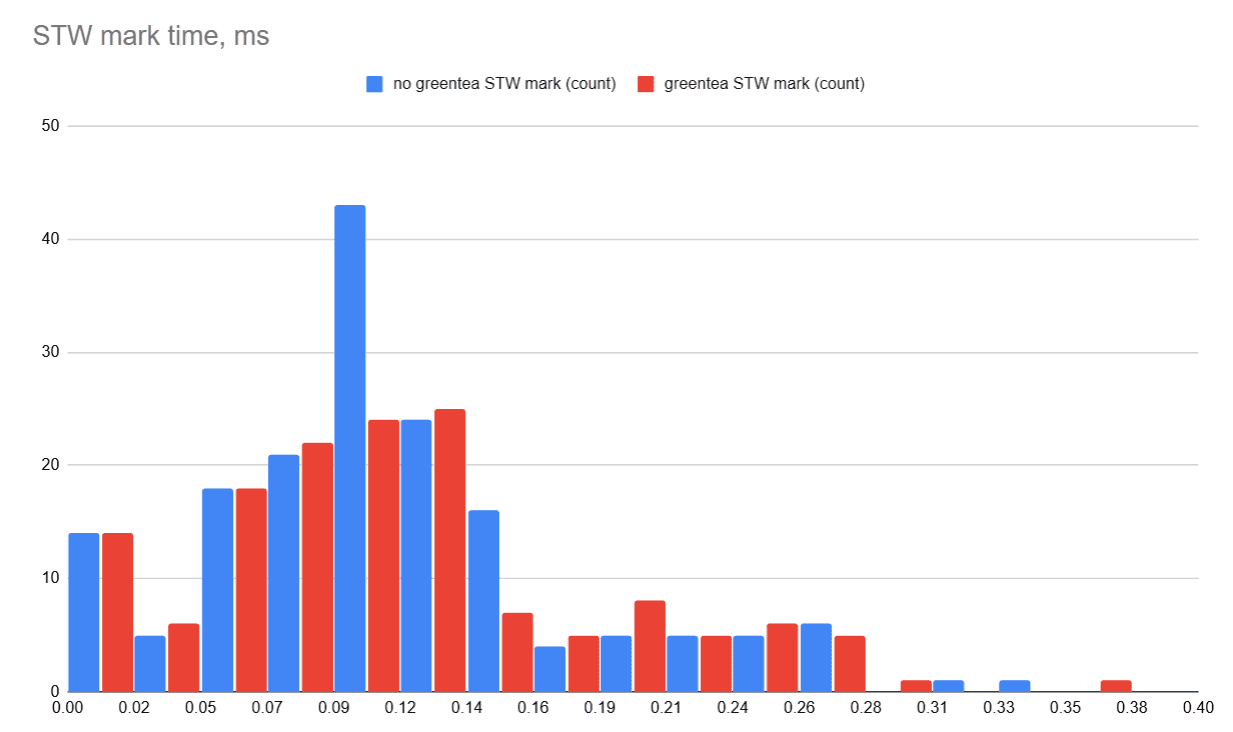
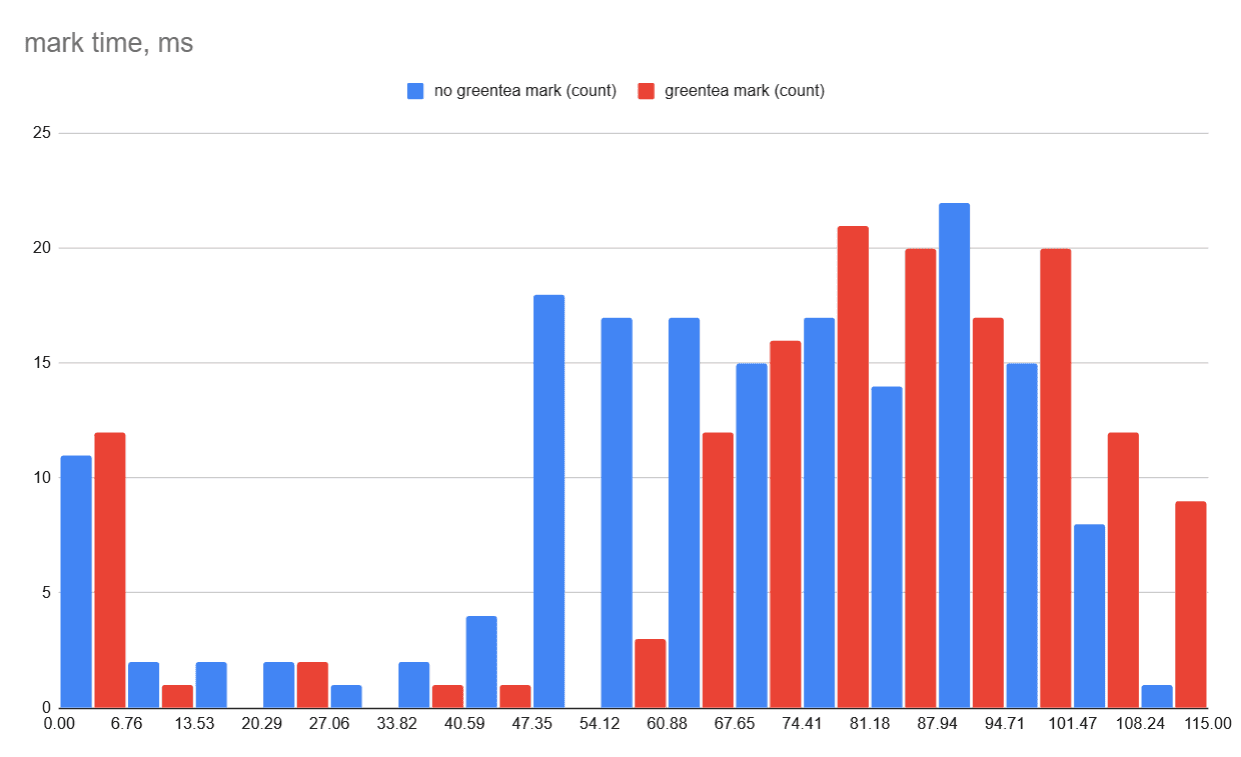
If anything, it looks like Green Tea is a small regression in garbage collection performance for Dolt under this workload, with noticeably elevated mark durations, but no significant difference in pause times.
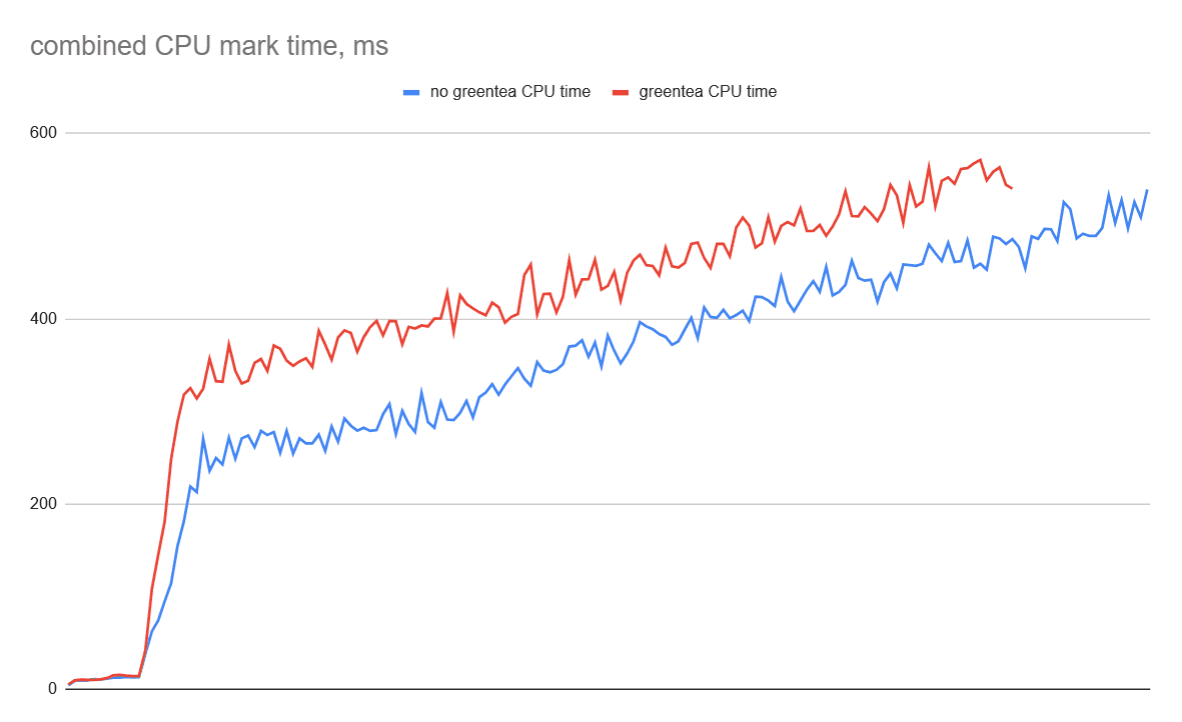
Looking at CPU time for the mark phase makes this more noticeable. I summed all three metrics for CPU time during mark (assist time, background GC time, and idle GC time) because I don't understand enough about garbage collection internals to know which ones to examine.
When we plot this, you can see that Green Tea is consistently spending more CPU time during mark at every garbage collection. There were also more GCs without Green Tea enabled, because they were shorter. Note that the live heap continually grows during this benchmark run, so we do expect GC to take longer and longer as the process runs.
This was the opposite result I expected to obtain after reading comments like this one. This made me nervous that I accidentally mixed up the files to analyze at some point during the process of collecting and crunching the numbers. (People on the internet are really mean when you publish a mistake, ask me how I know). But I double-checked everything, and as far as I can tell, it's a genuine result. I'm interested in hearing from anyone more knowledgeable about Go garbage collection and Green Tea in particular about what might cause this.
For Dolt, the Green Tea collector doesn't make any difference in real-world performance numbers. Under the hood, it seems that there's a small regression in mark time, but this isn't measurable in our latency benchmarks. Based on this result, we won't be enabling Green Tea for our production builds, but we also aren't too worried about it becoming the default in a future version of Go.
Have a question about Dolt? Want to talk about Go garbage collection? Come by our Discord and talk to our engineering team. We hope to see you there.