When More Cores Means Less Speed: Debugging PyTorch with Valgrind on ARM
3 months ago
1
If you’ve ever tried to debug a PyTorch program on an ARM64 system using
Valgrind, you might have stumbled on something really
odd: “Why does it take so long?”. And if you’re like us, you would probably try
to run it locally, on a Raspberry pi, to see what’s going on… And the madness
begins!
TL;DR, as you probably figured out from the title of this post, it’s a
counter-intuitive experience: the more cores your machine has, the slower your
(torch) code seems to run under Valgrind. Shouldn’t more cores mean more speed?
Let’s dive into why that’s not always the case ;)
In an effort to improve our testing infrastructure for
vAccel and make it more robust, we
started cleaning up our examples, unifying the build & test scripts and started
adding more elaborate test cases for both the library and the plugins.
Valgrind provides a quite decent experience for this, especially to catch
multi-arch errors, memory leaks and dangling pointers (something quite common
when writing in C :D).
While adding the Valgrind mode of execution in our tests for the vAccel
plugins, we noticed something really weird in the
Torch
case. The test was taking forever!
Figure 1: Build & Test run on amd64
Specifically, while the equivalent amd64 was taking roughly 4 and a half
minutes (Figure 1), the arm64 run was taking nearly an hour (53 minutes) –
see Figure 2.
The first thing that came to mind was that there’s something wrong with our
infrastructure. We run self-hosted Github runners, with custom container images
that support the relevant software components we need for each plugin/case. We
run those on our infra, a set of VMs running on top of diverse low-end
bare-metal machines, both amd64 and arm64. The arm64 runners run on a
couple of Jetson AGX Orins, with 8 cores and 32GB of RAM.
And what’s the first thing to try (especially when debugging on arm64? A
Raspberry Pi of course!
So getting the runner container image on a Raspberry Pi 5, with 8GB of RAM,
spinning up the container, building the library and the plugin, all took
roughly 10 minutes. And we’re ready for the test:
1# ninja run-examples-valgrind -C build-container
2ninja: Entering directory `build-container'
3[0/1] Running external command run-examples-valgrind (wrapped by meson to set env)
4Arch is 64bit : true
5[snipped]
6Running examples with plugin 'libvaccel-torch.so'
7+ valgrind --leak-check=full --show-leak-kinds=all --track-origins=yes --errors-for-leak-kinds=all --max-stackframe=3150000 --keep-debuginfo=yes --error-exitcode=1 --suppressions=/home/ananos/develop/vaccel-plugin-torch/scripts/common/config/valgrind.supp --main-stacksize=33554432 --max-stackframe=4000000 --suppressions=/home/ananos/develop/vaccel-plugin-torch/scripts/config/valgrind.supp /home/runner/artifacts/bin/torch_inference /home/runner/artifacts/share/vaccel/images/example.jpg https://s3.nbfc.io/torch/mobilenet.pt /home/runner/artifacts/share/vaccel/labels/imagenet.txt
8==371== Memcheck, a memory error detector
9==371== Copyright (C) 2002-2024, and GNU GPL'd, by Julian Seward et al.
10==371== Using Valgrind-3.25.1 and LibVEX; rerun with -h for copyright info
11==371== Command: /home/runner/artifacts/bin/torch_inference /home/runner/artifacts/share/vaccel/images/example.jpg https://s3.nbfc.io/torch/mobilenet.pt /home/runner/artifacts/share/vaccel/labels/imagenet.txt
12==371==
132025.07.10-20:48:01.91 - <debug> Initializing vAccel
142025.07.10-20:48:01.93 - <info> vAccel 0.7.1-9-b175578f
152025.07.10-20:48:01.93 - <debug> Config:
162025.07.10-20:48:01.93 - <debug> plugins = libvaccel-torch.so
172025.07.10-20:48:01.93 - <debug> log_level = debug
182025.07.10-20:48:01.93 - <debug> log_file = (null)
192025.07.10-20:48:01.93 - <debug> profiling_enabled = false
202025.07.10-20:48:01.93 - <debug> version_ignore = false
212025.07.10-20:48:01.94 - <debug> Created top-level rundir: /run/user/0/vaccel/ZpNkGT
222025.07.10-20:48:47.87 - <info> Registered plugin torch 0.2.1-3-0b1978fb
23[snipped]
242025.07.10-20:48:48.07 - <debug> Downloading https://s3.nbfc.io/torch/mobilenet.pt
252025.07.10-20:48:53.18 - <debug> Downloaded: 2.4 KB of 13.7 MB (17.2%) | Speed: 474.96 KB/sec
262025.07.10-20:48:54.93 - <debug> Downloaded: 13.7 MB of 13.7 MB (100.0%) | Speed: 2.01 MB/sec
272025.07.10-20:48:54.95 - <debug> Download completed successfully
282025.07.10-20:48:55.04 - <debug> session:1 Registered resource 1
292025.07.10-20:48:56.37 - <debug> session:1 Looking for plugin implementing torch_jitload_forward operation
302025.07.10-20:48:56.37 - <debug> Returning func from hint plugin torch
31[snipped]
32CUDA not available, running in CPU mode
33Success!
34Result Tensor :
35Output tensor => type:7 nr_dims:2
36size: 4000 B
37Prediction: banana
38[snipped]
39==371== HEAP SUMMARY:
40==371== in use at exit: 339,636 bytes in 3,300 blocks
41==371== total heap usage: 1,779,929 allocs, 1,776,629 frees, 405,074,676 bytes allocated
42==371==
43==371== LEAK SUMMARY:
44==371== definitely lost: 0 bytes in 0 blocks
45==371== indirectly lost: 0 bytes in 0 blocks
46==371== possibly lost: 0 bytes in 0 blocks
47==371== still reachable: 0 bytes in 0 blocks
48==371== suppressed: 339,636 bytes in 3,300 blocks
49==371==
50==371== For lists of detected and suppressed errors, rerun with: -s
51==371== ERROR SUMMARY: 0 errors from 0 contexts (suppressed: 3160 from 3160)
52+ valgrind --leak-check=full --show-leak-kinds=all --track-origins=yes --errors-for-leak-kinds=all --max-stackframe=3150000 --keep-debuginfo=yes --error-exitcode=1 --suppressions=/home/ananos/develop/vaccel-plugin-torch/scripts/common/config/valgrind.supp --main-stacksize=33554432 --max-stackframe=4000000 --suppressions=/home/ananos/develop/vaccel-plugin-torch/scripts/config/valgrind.supp /home/runner/artifacts/bin/classify /home/runner/artifacts/share/vaccel/images/example.jpg 1 https://s3.nbfc.io/torch/mobilenet.pt
53==376== Memcheck, a memory error detector
54==376== Copyright (C) 2002-2024, and GNU GPL'd, by Julian Seward et al.
55==376== Using Valgrind-3.25.1 and LibVEX; rerun with -h for copyright info
56==376== Command: /home/runner/artifacts/bin/classify /home/runner/artifacts/share/vaccel/images/example.jpg 1 https://s3.nbfc.io/torch/mobilenet.pt
57==376==
582025.07.10-20:54:37.78 - <debug> Initializing vAccel
592025.07.10-20:54:37.80 - <info> vAccel 0.7.1-9-b175578f
602025.07.10-20:54:37.80 - <debug> Config:
612025.07.10-20:54:37.80 - <debug> plugins = libvaccel-torch.so
622025.07.10-20:54:37.80 - <debug> log_level = debug
632025.07.10-20:54:37.80 - <debug> log_file = (null)
64[snipped]
652025.07.10-20:55:30.78 - <debug> Found implementation in torch plugin
662025.07.10-20:55:30.78 - <debug> [torch] Loading model from /run/user/0/vaccel/zazTtc/resource.1/mobilenet.pt
67CUDA not available, running in CPU mode
682025.07.10-21:01:14.77 - <debug> [torch] Prediction: banana
69classification tags: banana
70[snipped]
712025.07.10-21:01:23.92 - <debug> Unregistered plugin torch
72==376==
73==376== HEAP SUMMARY:
74==376== in use at exit: 341,280 bytes in 3,304 blocks
75==376== total heap usage: 3,167,523 allocs, 3,164,219 frees, 534,094,402 bytes allocated
76==376==
77==376== LEAK SUMMARY:
78==376== definitely lost: 0 bytes in 0 blocks
79==376== indirectly lost: 0 bytes in 0 blocks
80==376== possibly lost: 0 bytes in 0 blocks
81==376== still reachable: 0 bytes in 0 blocks
82==376== suppressed: 341,280 bytes in 3,304 blocks
83==376==
84==376== For lists of detected and suppressed errors, rerun with: -s
85==376== ERROR SUMMARY: 0 errors from 0 contexts (suppressed: 3161 from 3161)
86+ set +x
Note: We’ll talk about the suppressions a bit later
The test took roughly 13 minutes. At this point, we were scratching our heads.
Why would a high-end Jetson Orin, with way more cores and RAM, perform so much
worse under Valgrind than a humble Raspberry Pi? Time to dig deeper into what’s
really going on under the hood…
When the results came in, the numbers were still striking: the same
Valgrind-wrapped Torch test that took almost an hour on our Jetson Orin
finished in just 13 minutes on the Raspberry Pi. The Pi, with far less RAM and
CPU muscle, still managed to outperform the Orin by a wide margin under these
specific conditions.
This result was the definition of counter-intuitive. Everything we know about
hardware says the Orin should wipe the floor with the Pi. Yet, here we were,
staring at the Pi’s prompt, wondering if we’d missed something obvious.
So, what’s going on? Why does a high-end, multi-core ARM system get crushed by
a humble Pi in this scenario? The answer lies at the intersection of Valgrind,
multi-threaded workloads, and the quirks of the ARM64 ecosystem.
Modern CPUs, especially high-end ARM chips like the Orin, have lots of cores,
and frameworks like PyTorch are eager to use them all. By default, PyTorch will
spawn as many threads as it thinks your system can handle, aiming for maximum
parallelism.
But Valgrind, which works by instrumenting every memory access and
synchronizing thread activity to catch bugs, doesn’t scale gracefully with
thread count. In fact:
Each additional thread multiplies Valgrind’s overhead. More threads mean more
context switches, more synchronization, and more internal bookkeeping.
On platforms where Valgrind’s threading support is less mature (like
aarch64), this overhead can balloon out of control.
On the Raspberry Pi, with its modest core count, PyTorch only spawns a
handful of threads. But on the Orin, with many more cores, PyTorch ramps up
the thread count—and Valgrind’s overhead explodes.
The arm64 port of Valgrind is still catching up to its amd64 sibling in
terms of optimizations and robustness. Some operations, especially those
involving threads and memory, are simply slower to emulate and track on arm64.
This compounds the thread explosion problem, making high-core-count systems
paradoxically slower under Valgrind.
Dealing with library suppressions on arm64 with Valgrind
Link to heading
For instance, when running applications that rely on specific libraries under
Valgrind on arm64 systems, developers frequently encounter a barrage of
memory-related warnings and errors. Many of these issues are not actual bugs in
your code, but rather artifacts of how these libraries manage memory
internally, or limitations in Valgrind’s emulation on such architectures.
For instance, OpenSSL is known for its custom memory management strategies. It
often allocates memory statically or uses platform-specific tricks, which can
confuse Valgrind’s memory checker. For example, you might see reports of
“still reachable” memory or even “definitely lost” memory at program exit.
In reality, much of this memory is intentionally held for the lifetime of the
process—such as global tables or the state for the random number generator.
These are not leaks in the conventional sense, but Valgrind will still flag
them, especially if you run with strict leak checking enabled.
On arm64 platforms, the situation can be further complicated. Valgrind may
not fully emulate every instruction used by the specific library. This can lead
to false positives, such as uninitialized value warnings, or even more dramatic
errors like SIGILL (illegal instruction) if Valgrind encounters an
unsupported operation.
It’s not uncommon to see a flood of warnings that are, in practice, harmless or
simply not actionable unless you’re developing for that specific library itself.
To manage this noise and focus on real issues in our application, we use
Valgrind’s suppression mechanism. Suppression files allow us
to tell Valgrind to ignore specific known issues, so we can zero in on genuine
bugs in our own code.
Suppression entries are typically matched by library object names, so on
arm64 we use patterns like /usr/lib/aarch64-linux-gnu/libssh.so* or
obj:*libc10*.so*, obj:*libtorch*.so*.
An example suppression snippet (valgrind.supp) looks like the following:
It’s important to note that not all problems can be suppressed away. For
example, if Valgrind encounters a truly unsupported instruction and throws a
SIGILL, a suppression file won’t help; you may need to update Valgrind or avoid
that code path. Still, for the majority of benign memory warnings from OpenSSL
or Torch, well-crafted suppressions keeps our Valgrind output manageable
and meaningful.
Another factor: large binaries with lots of debug symbols (common in deep
learning stacks) can cause Valgrind to spend an inordinate amount of time just
parsing and managing symbol information. The more complex the binary and its
dependencies, the longer the startup and runtime overhead. Again, amplified on
arm64.
Limit Thread Count: When running under Valgrind, explicitly set PyTorch to
use a single thread OMP_NUM_THREADS=1. This alone can make a world of
difference.
Test Small: Use the smallest possible model and dataset for Valgrind runs.
Save the big workloads for native or lighter-weight profiling tools.
Expect the Unexpected: Don’t assume that “bigger is better” when debugging
with Valgrind – sometimes, less really is more!
Profile Performance Separately: Use Valgrind for correctness and bug-hunting,
not for benchmarking or performance profiling.
And here’s the full snippet of the test, on a runner VM on the Jetson Orin,
taking less than 6 minutes:
1$ ninja run-examples-valgrind -C build
2ninja: Entering directory `build'
3[0/1] Running external command run-examples-valgrind (wrapped by meson to set env)
4Arch is 64bit : true
5Default config dir : /home/ananos/vaccel-plugin-torch/scripts/common/config
6Package : vaccel-torch
7Package config dir : /home/ananos/vaccel-plugin-torch/scripts/config
8Package lib dir : /home/ananos/vaccel-plugin-torch/build/src
9vAccel prefix : /home/runner/artifacts
10vAccel lib dir : /home/runner/artifacts/lib/aarch64-linux-gnu
11vAccel bin dir : /home/runner/artifacts/bin
12vAccel share dir : /home/runner/artifacts/share/vaccel
13 14 15Running examples with plugin 'libvaccel-torch.so'
16+ eval valgrind --leak-check=full --show-leak-kinds=all --track-origins=yes --errors-for-leak-kinds=all --max-stackframe=3150000 --keep-debuginfo=yes --error-exitcode=1 --suppressions=/home/ananos/vaccel-plugin-torch/scripts/common/config/valgrind.supp --main-stacksize=33554432 --max-stackframe=4000000 --fair-sched=no --suppressions=/home/ananos/vaccel-plugin-torch/scripts/config/valgrind.supp /home/runner/artifacts/bin/torch_inference /home/runner/artifacts/share/vaccel/images/example.jpg https://s3.nbfc.io/torch/mobilenet.pt /home/runner/artifacts/share/vaccel/labels/imagenet.txt
17+ valgrind --leak-check=full --show-leak-kinds=all --track-origins=yes --errors-for-leak-kinds=all --max-stackframe=3150000 --keep-debuginfo=yes --error-exitcode=1 --suppressions=/home/ananos/vaccel-plugin-torch/scripts/common/config/valgrind.supp --main-stacksize=33554432 --max-stackframe=4000000 --fair-sched=no --suppressions=/home/ananos/vaccel-plugin-torch/scripts/config/valgrind.supp /home/runner/artifacts/bin/torch_inference /home/runner/artifacts/share/vaccel/images/example.jpg https://s3.nbfc.io/torch/mobilenet.pt /home/runner/artifacts/share/vaccel/labels/imagenet.txt
18==1655== Memcheck, a memory error detector
19==1655== Copyright (C) 2002-2024, and GNU GPL'd, by Julian Seward et al.
20==1655== Using Valgrind-3.25.1 and LibVEX; rerun with -h for copyright info
21==1655== Command: /home/runner/artifacts/bin/torch_inference /home/runner/artifacts/share/vaccel/images/example.jpg https://s3.nbfc.io/torch/mobilenet.pt /home/runner/artifacts/share/vaccel/labels/imagenet.txt
22==1655==
232025.07.10-20:06:28.83 - <debug> Initializing vAccel
242025.07.10-20:06:28.85 - <info> vAccel 0.7.1-9-b175578f
252025.07.10-20:06:28.86 - <debug> Config:
262025.07.10-20:06:28.86 - <debug> plugins = libvaccel-torch.so
272025.07.10-20:06:28.86 - <debug> log_level = debug
282025.07.10-20:06:28.86 - <debug> log_file = (null)
292025.07.10-20:06:28.86 - <debug> profiling_enabled = false
302025.07.10-20:06:28.86 - <debug> version_ignore = false
312025.07.10-20:06:28.87 - <debug> Created top-level rundir: /run/user/1000/vaccel/P01ae4
322025.07.10-20:07:27.35 - <info> Registered plugin torch 0.2.1-3-0b1978fb
332025.07.10-20:07:27.35 - <debug> Registered op torch_jitload_forward from plugin torch
342025.07.10-20:07:27.35 - <debug> Registered op torch_sgemm from plugin torch
352025.07.10-20:07:27.35 - <debug> Registered op image_classify from plugin torch
362025.07.10-20:07:27.35 - <debug> Loaded plugin torch from libvaccel-torch.so
372025.07.10-20:07:27.39 - <debug> Initialized resource 1
38Initialized model resource 1
392025.07.10-20:07:27.39 - <debug> New rundir for session 1: /run/user/1000/vaccel/P01ae4/session.1
402025.07.10-20:07:27.39 - <debug> Initialized session 1
41Initialized vAccel session 1
422025.07.10-20:07:27.40 - <debug> New rundir for resource 1: /run/user/1000/vaccel/P01ae4/resource.1
432025.07.10-20:07:27.62 - <debug> Downloading https://s3.nbfc.io/torch/mobilenet.pt
442025.07.10-20:07:33.90 - <debug> Downloaded: 555.7 KB of 13.7 MB (4.0%) | Speed: 88.84 KB/sec
452025.07.10-20:07:36.78 - <debug> Downloaded: 13.7 MB of 13.7 MB (100.0%) | Speed: 1.50 MB/sec
462025.07.10-20:07:36.80 - <debug> Download completed successfully
472025.07.10-20:07:36.94 - <debug> session:1 Registered resource 1
482025.07.10-20:07:38.16 - <debug> session:1 Looking for plugin implementing torch_jitload_forward operation
492025.07.10-20:07:38.16 - <debug> Returning func from hint plugin torch
502025.07.10-20:07:38.16 - <debug> Found implementation in torch plugin
512025.07.10-20:07:38.16 - <debug> [torch] session:1 Jitload & Forward Process
522025.07.10-20:07:38.16 - <debug> [torch] Model: /run/user/1000/vaccel/P01ae4/resource.1/mobilenet.pt
532025.07.10-20:07:38.17 - <debug> [torch] Loading model from /run/user/1000/vaccel/P01ae4/resource.1/mobilenet.pt
54CUDA not available, running in CPU mode
55Success!
56Result Tensor :
57Output tensor => type:7 nr_dims:2
58size: 4000 B
59Prediction: banana
602025.07.10-20:08:39.93 - <debug> session:1 Unregistered resource 1
612025.07.10-20:08:39.94 - <debug> Released session 1
622025.07.10-20:08:39.94 - <debug> Removing file /run/user/1000/vaccel/P01ae4/resource.1/mobilenet.pt
632025.07.10-20:08:39.95 - <debug> Released resource 1
642025.07.10-20:08:48.91 - <debug> Cleaning up vAccel
652025.07.10-20:08:48.91 - <debug> Cleaning up sessions
662025.07.10-20:08:48.91 - <debug> Cleaning up resources
672025.07.10-20:08:48.91 - <debug> Cleaning up plugins
682025.07.10-20:08:48.92 - <debug> Unregistered plugin torch
69==1655==
70==1655== HEAP SUMMARY:
71==1655== in use at exit: 304,924 bytes in 3,290 blocks
72==1655== total heap usage: 1,780,098 allocs, 1,776,808 frees, 406,800,553 bytes allocated
73==1655==
74==1655== LEAK SUMMARY:
75==1655== definitely lost: 0 bytes in 0 blocks
76==1655== indirectly lost: 0 bytes in 0 blocks
77==1655== possibly lost: 0 bytes in 0 blocks
78==1655== still reachable: 0 bytes in 0 blocks
79==1655== suppressed: 304,924 bytes in 3,290 blocks
80==1655==
81==1655== For lists of detected and suppressed errors, rerun with: -s
82==1655== ERROR SUMMARY: 0 errors from 0 contexts (suppressed: 3153 from 3153)
83+ [ 1 = 1 ]
84+ eval valgrind --leak-check=full --show-leak-kinds=all --track-origins=yes --errors-for-leak-kinds=all --max-stackframe=3150000 --keep-debuginfo=yes --error-exitcode=1 --suppressions=/home/ananos/vaccel-plugin-torch/scripts/common/config/valgrind.supp --main-stacksize=33554432 --max-stackframe=4000000 --fair-sched=no --suppressions=/home/ananos/vaccel-plugin-torch/scripts/config/valgrind.supp /home/runner/artifacts/bin/classify /home/runner/artifacts/share/vaccel/images/example.jpg 1 https://s3.nbfc.io/torch/mobilenet.pt
85+ valgrind --leak-check=full --show-leak-kinds=all --track-origins=yes --errors-for-leak-kinds=all --max-stackframe=3150000 --keep-debuginfo=yes --error-exitcode=1 --suppressions=/home/ananos/vaccel-plugin-torch/scripts/common/config/valgrind.supp --main-stacksize=33554432 --max-stackframe=4000000 --fair-sched=no --suppressions=/home/ananos/vaccel-plugin-torch/scripts/config/valgrind.supp /home/runner/artifacts/bin/classify /home/runner/artifacts/share/vaccel/images/example.jpg 1 https://s3.nbfc.io/torch/mobilenet.pt
86==1657== Memcheck, a memory error detector
87==1657== Copyright (C) 2002-2024, and GNU GPL'd, by Julian Seward et al.
88==1657== Using Valgrind-3.25.1 and LibVEX; rerun with -h for copyright info
89==1657== Command: /home/runner/artifacts/bin/classify /home/runner/artifacts/share/vaccel/images/example.jpg 1 https://s3.nbfc.io/torch/mobilenet.pt
90==1657==
912025.07.10-20:08:50.40 - <debug> Initializing vAccel
922025.07.10-20:08:50.42 - <info> vAccel 0.7.1-9-b175578f
932025.07.10-20:08:50.42 - <debug> Config:
942025.07.10-20:08:50.42 - <debug> plugins = libvaccel-torch.so
952025.07.10-20:08:50.42 - <debug> log_level = debug
962025.07.10-20:08:50.42 - <debug> log_file = (null)
972025.07.10-20:08:50.42 - <debug> profiling_enabled = false
982025.07.10-20:08:50.42 - <debug> version_ignore = false
992025.07.10-20:08:50.43 - <debug> Created top-level rundir: /run/user/1000/vaccel/73XJNT
1002025.07.10-20:09:48.93 - <info> Registered plugin torch 0.2.1-3-0b1978fb
1012025.07.10-20:09:48.93 - <debug> Registered op torch_jitload_forward from plugin torch
1022025.07.10-20:09:48.93 - <debug> Registered op torch_sgemm from plugin torch
1032025.07.10-20:09:48.93 - <debug> Registered op image_classify from plugin torch
1042025.07.10-20:09:48.93 - <debug> Loaded plugin torch from libvaccel-torch.so
1052025.07.10-20:09:48.94 - <debug> New rundir for session 1: /run/user/1000/vaccel/73XJNT/session.1
1062025.07.10-20:09:48.95 - <debug> Initialized session 1
107Initialized session with id: 1
1082025.07.10-20:09:48.97 - <debug> Initialized resource 1
1092025.07.10-20:09:48.98 - <debug> New rundir for resource 1: /run/user/1000/vaccel/73XJNT/resource.1
1102025.07.10-20:09:49.19 - <debug> Downloading https://s3.nbfc.io/torch/mobilenet.pt
1112025.07.10-20:09:55.17 - <debug> Downloaded: 816.6 KB of 13.7 MB (5.8%) | Speed: 137.30 KB/sec
1122025.07.10-20:09:57.71 - <debug> Downloaded: 13.7 MB of 13.7 MB (100.0%) | Speed: 1.62 MB/sec
1132025.07.10-20:09:57.73 - <debug> Download completed successfully
1142025.07.10-20:09:57.87 - <debug> session:1 Registered resource 1
1152025.07.10-20:09:57.88 - <debug> session:1 Looking for plugin implementing VACCEL_OP_IMAGE_CLASSIFY
1162025.07.10-20:09:57.88 - <debug> Returning func from hint plugin torch
1172025.07.10-20:09:57.88 - <debug> Found implementation in torch plugin
1182025.07.10-20:09:57.88 - <debug> [torch] Loading model from /run/user/1000/vaccel/73XJNT/resource.1/mobilenet.pt
119CUDA not available, running in CPU mode
1202025.07.10-20:11:31.42 - <debug> [torch] Prediction: banana
121classification tags: banana
122classification imagename: PLACEHOLDER
1232025.07.10-20:11:31.93 - <debug> session:1 Unregistered resource 1
1242025.07.10-20:11:31.93 - <debug> Removing file /run/user/1000/vaccel/73XJNT/resource.1/mobilenet.pt
1252025.07.10-20:11:31.94 - <debug> Released resource 1
1262025.07.10-20:11:31.95 - <debug> Released session 1
1272025.07.10-20:11:44.12 - <debug> Cleaning up vAccel
1282025.07.10-20:11:44.12 - <debug> Cleaning up sessions
1292025.07.10-20:11:44.12 - <debug> Cleaning up resources
1302025.07.10-20:11:44.12 - <debug> Cleaning up plugins
1312025.07.10-20:11:44.12 - <debug> Unregistered plugin torch
132==1657==
133==1657== HEAP SUMMARY:
134==1657== in use at exit: 306,616 bytes in 3,294 blocks
135==1657== total heap usage: 3,167,511 allocs, 3,164,217 frees, 533,893,229 bytes allocated
136==1657==
137==1657== LEAK SUMMARY:
138==1657== definitely lost: 0 bytes in 0 blocks
139==1657== indirectly lost: 0 bytes in 0 blocks
140==1657== possibly lost: 0 bytes in 0 blocks
141==1657== still reachable: 0 bytes in 0 blocks
142==1657== suppressed: 306,616 bytes in 3,294 blocks
143==1657==
144==1657== For lists of detected and suppressed errors, rerun with: -s
145==1657== ERROR SUMMARY: 0 errors from 0 contexts (suppressed: 3153 from 3153)
146+ set +x
and the actual test in Figure 3, taking 8 minutes, almost 7 times faster than
the original execution:
This experience was a great reminder that debugging tools and parallel
workloads don’t always play nicely, especially on less mature platforms.
Sometimes, the humble Raspberry Pi will leave a high-end chip in the dust,
at least when Valgrind is in the mix.
So next time you’re staring at a progress bar that refuses to budge, remember:
more cores might just mean more waiting. And don’t be afraid to try your tests
on the “little guy” – you might be surprised by what you find.
.png)

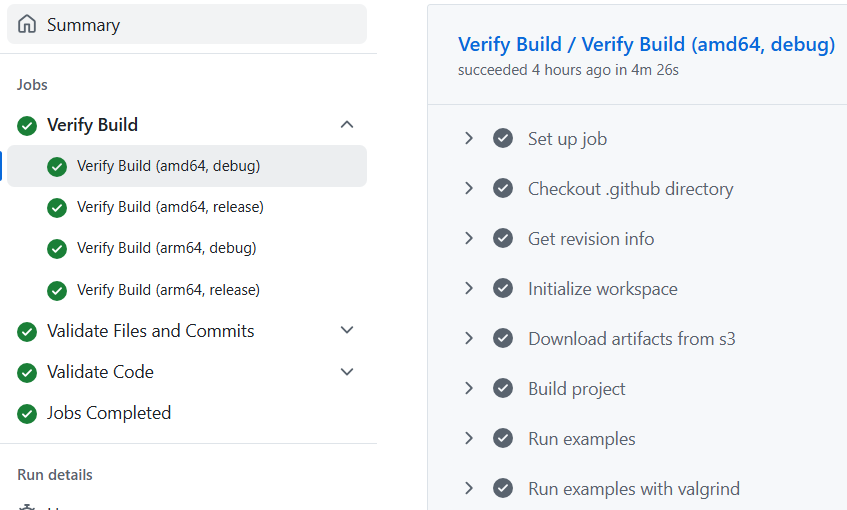 Figure 1: Build & Test run on amd64
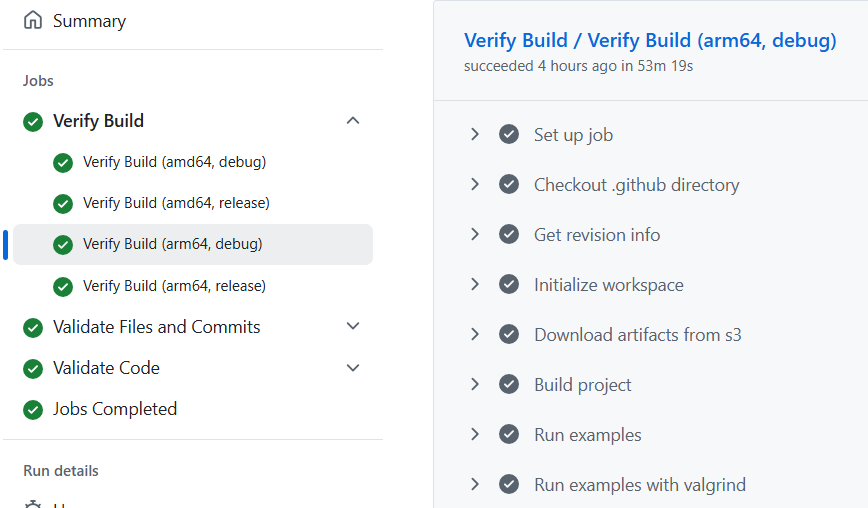 Figure 2: Why is it taking sooo long?
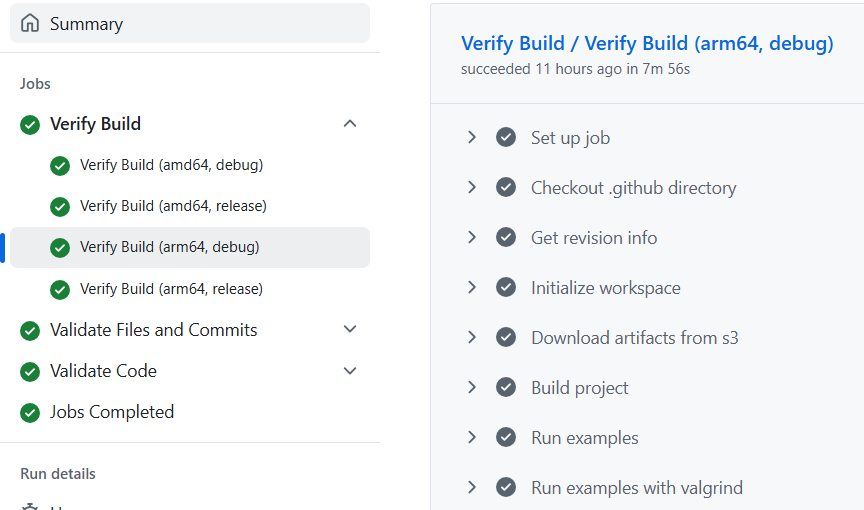 Figure 3: Fixed arm64 valgrind test