.png)

So here's what happened. You spent a weekend building a shared grocery list app: Flask backend, a bit of Alpine.js for the frontend, PostgreSQL because you know it. You posted it on Twitter with a casual "made a thing" and went to bed.
You wake up to 50,000 people trying to use it at once.
Your $5/month VPS is melting. The app is down. People are commenting "bro your server is cooked" and you're frantically googling "how to scale a flask app." Someone replies with "just throw it in Kubernetes lol" and honestly, at this point, why not?
So you hack together a basic Kubernetes setup. Copy some YAML from Stack Overflow, adjust the indentation until kubectl apply works, and somehow you've got pods running. You set up a HorizontalPodAutoscaler because a blog post said you should. The app is back online. Crisis averted.
But now you have a new problem: you have no idea what's happening inside your cluster.
Are the pods actually scaling? Is the database the bottleneck? Why did that pod restart three times? Your mental model is "Kubernetes is a magic box where containers go to live," and that was fine until it wasn't.
You need monitoring. So you start googling.
We'll explore three popular monitoring platforms: SigNoz, DataDog, and Grafana.
The Three Options
The search results all say the same three names: SigNoz, DataDog, and Grafana. But they're described in enterprise SRE language that assumes you already know what "cardinality" means.
Here's what you actually need to know:
SigNoz is the "just works" option. It's open source, runs locally, and is designed for developers who want observability without becoming infrastructure experts. If you've used Postman or Docker Desktop, SigNoz feels familiar: install it, point your app at it, done.
DataDog is the enterprise option that everyone in DevOps circles mentions. It has every feature imaginable, along with the complexity and pricing to match. The free tier (5 hosts, 1 million log events) doesn't require a credit card, but the setup assumes you know what a Kubernetes Operator is.
Grafana Cloud is the "maximum flexibility" option. It's powerful, the free tier is generous, and many companies with platform teams eventually use it. But that power comes with decisions. Lots of them. You'll be learning PromQL query syntax before you see your first dashboard.
What we'll be doing in this guide
We deployed the same autoscaling grocery list app to Kubernetes three times: once with SigNoz, once with DataDog, and once with Grafana Cloud.
This isn't a feature comparison chart. It's what actually setting these up feels like when you've never done infrastructure monitoring before. We'll show you the errors we hit, the docs that didn't make sense, and how long it took to see the first meaningful metric.
By the end, you'll know which one fits where you are right now. Maybe that's SigNoz because you just want it to work. Maybe it's Grafana because you're willing to learn in exchange for flexibility. Or maybe it's DataDog because your company already pays for it.
Let's start with what we're actually monitoring.
The App We're Monitoring
The actual app is a shared grocery list. Yes, another list app. But here's why it matters.
To test monitoring platforms, you need an app that actually does something. A static website using 10MB of RAM tells you nothing. You need CPU spikes, memory pressure, database queries, pod restarts, and autoscaling events. The kind of chaos that makes you wish you had monitoring in the first place.
The Setup
For this demo, everything runs on Docker Desktop's built-in Kubernetes on a MacBook M4 Pro (24GB RAM, 12 cores). Docker Desktop is configured with:
- 8GB RAM allocated to the Docker VM
- 6 CPU cores
- Kubernetes enabled (the checkbox in Docker Desktop settings)
In production, you'd likely run this on AWS EKS, Google GKE, or Azure AKS. But for learning and testing monitoring platforms, Docker Desktop works perfectly. It's free. The constrained resources (8GB RAM, 6 cores) actually make autoscaling behavior more dramatic and monitoring more necessary, which is what we want for this comparison.
The grocery list app consists of:
- Flask API handling user authentication and list operations
- PostgreSQL for storing users, lists, and permissions
- Alpine.js frontend (no full React build needed for a demo)
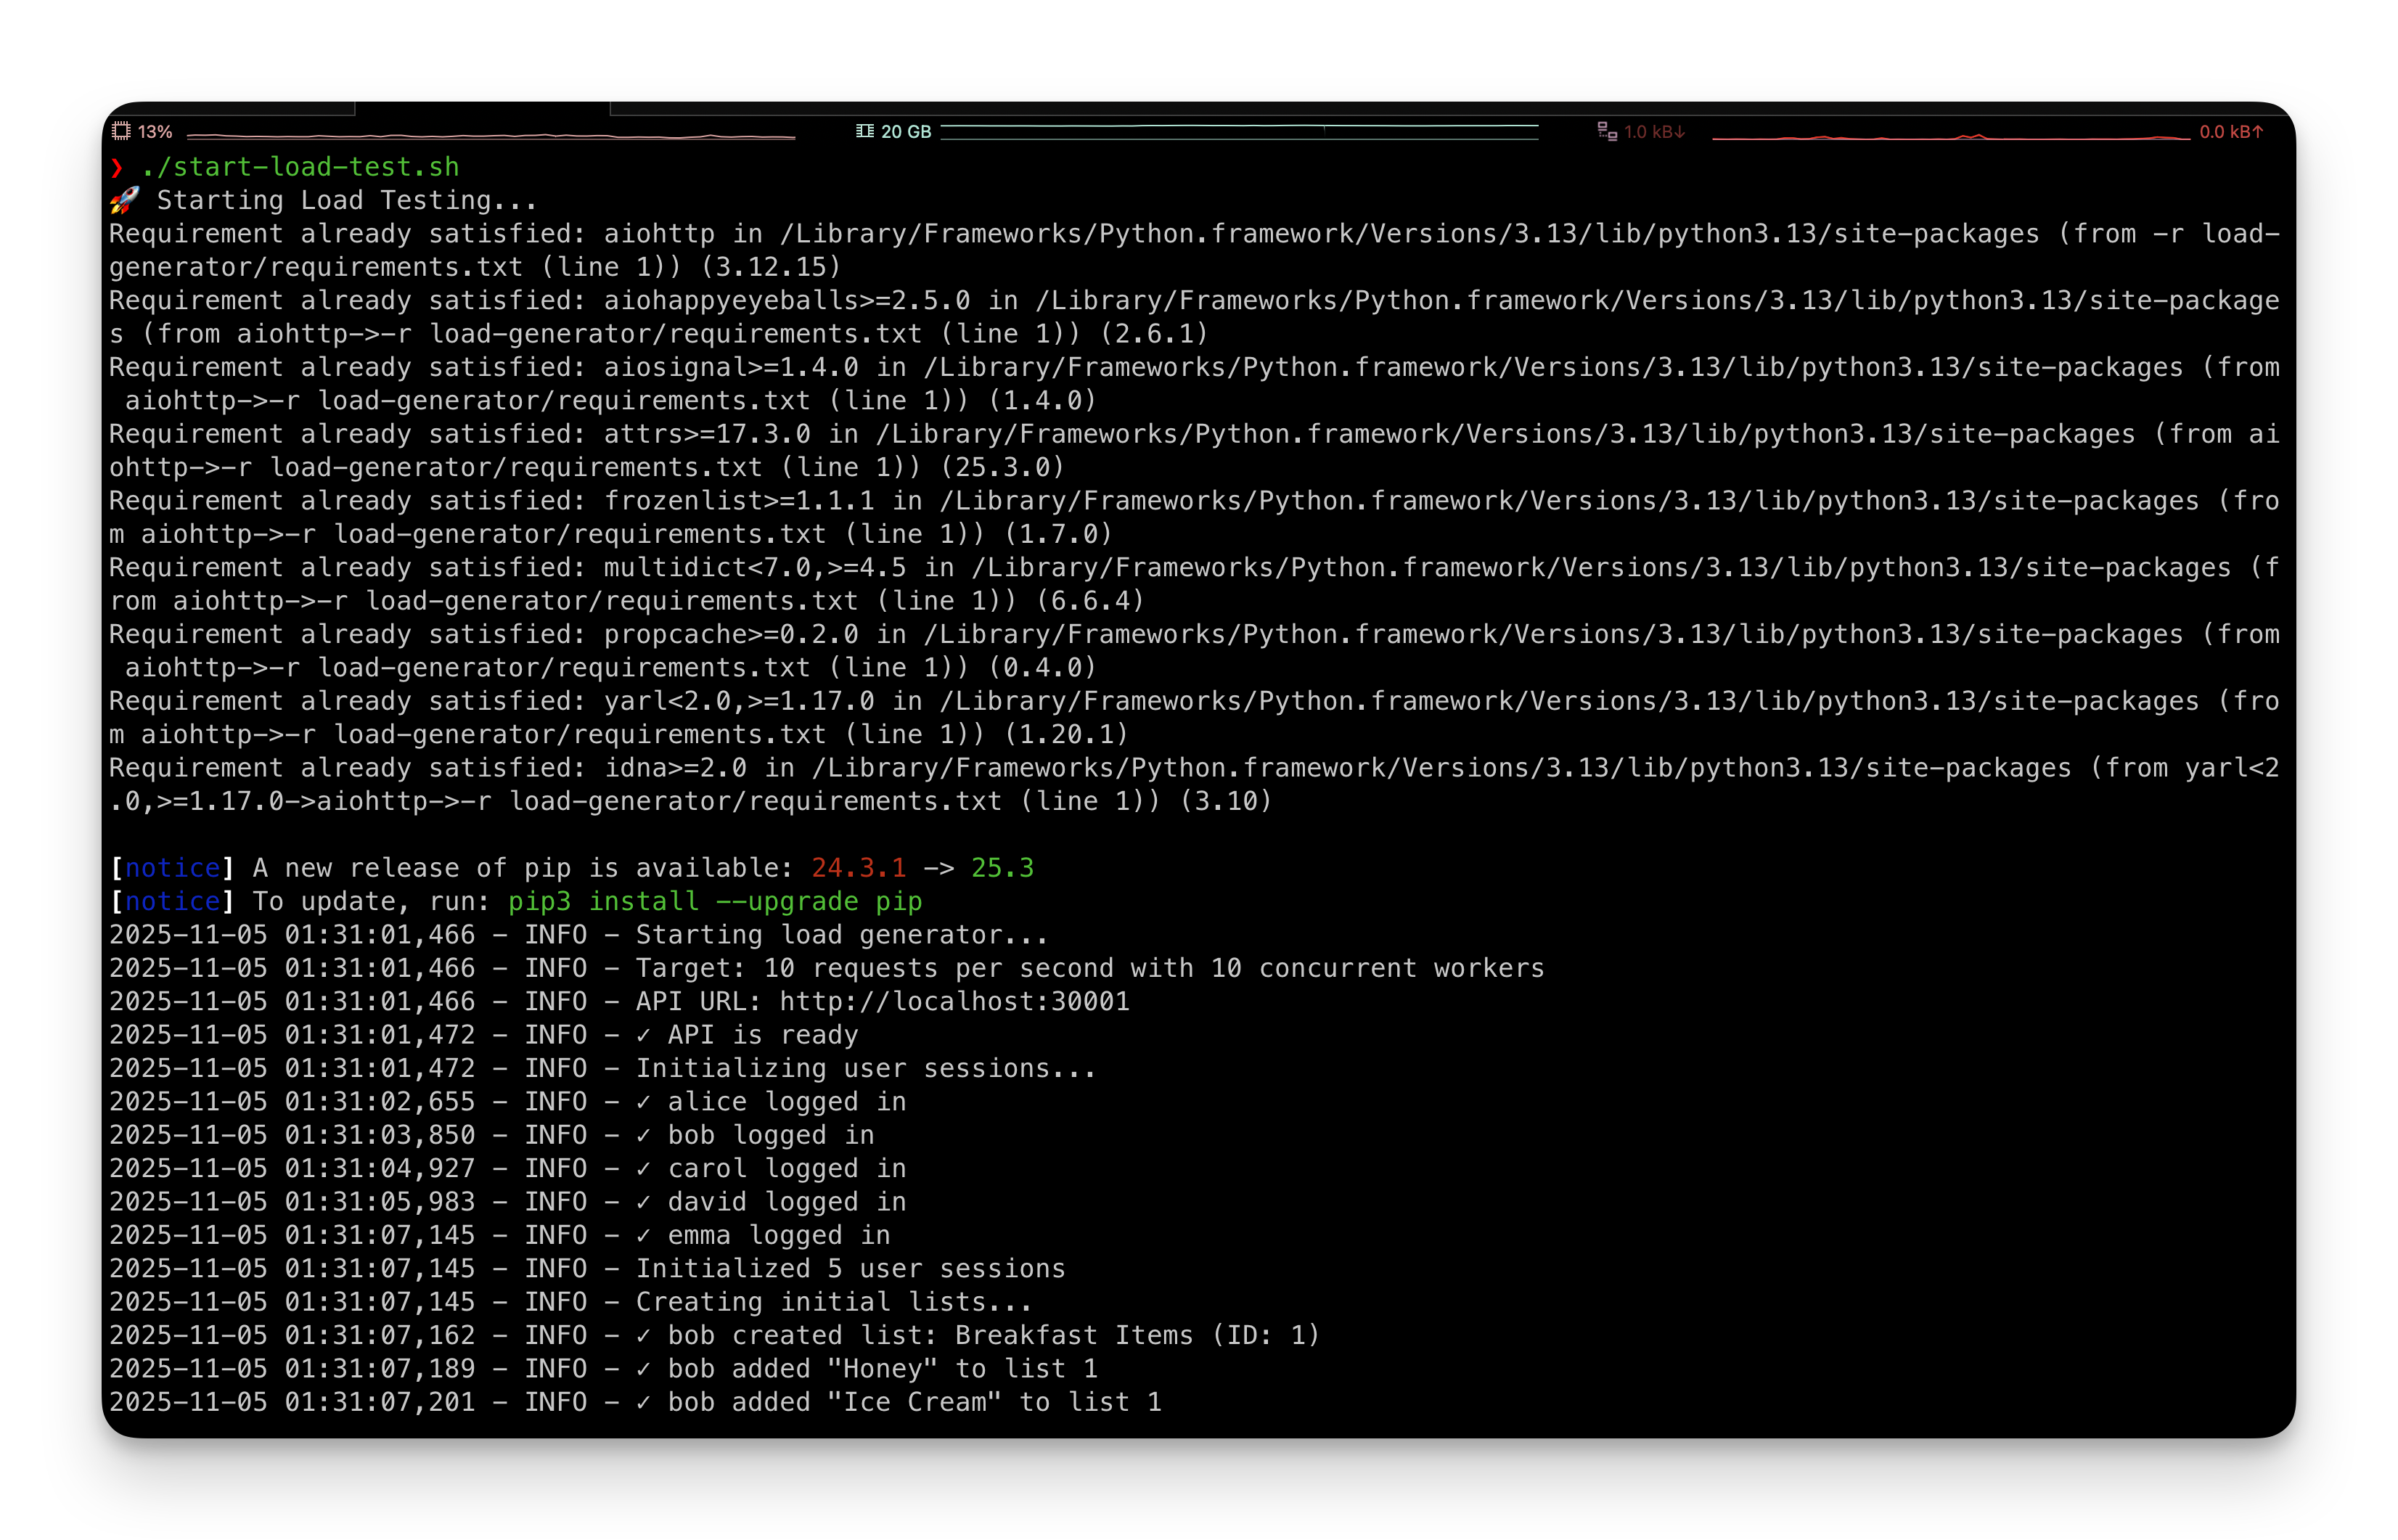
- Load generators that simulate 100 requests per second from five fake users
The important part: it autoscales. The API starts with 1 pod and scales to 5 when CPU hits 50%. The frontend scales from 1 to 3 pods. Within a minute of starting the load generators, CPU spikes to 200%, then Kubernetes spins up more pods until things stabilize.
This gives us something real to monitor: traces from API requests, logs from database queries, metrics showing pod CPU usage climbing, and events when Kubernetes makes scaling decisions. If a monitoring platform can't show this clearly, it's not worth using.
Round 1: SigNoz
We're starting with SigNoz because the docs promise "runs locally in minutes," which sounds incredible after dealing with Kubernetes YAML.
cd signoz/deploy/
./install.sh
That's it. The script pulls Docker images, starts containers, and three minutes later you're at http://localhost:8080 with a dashboard already loaded.
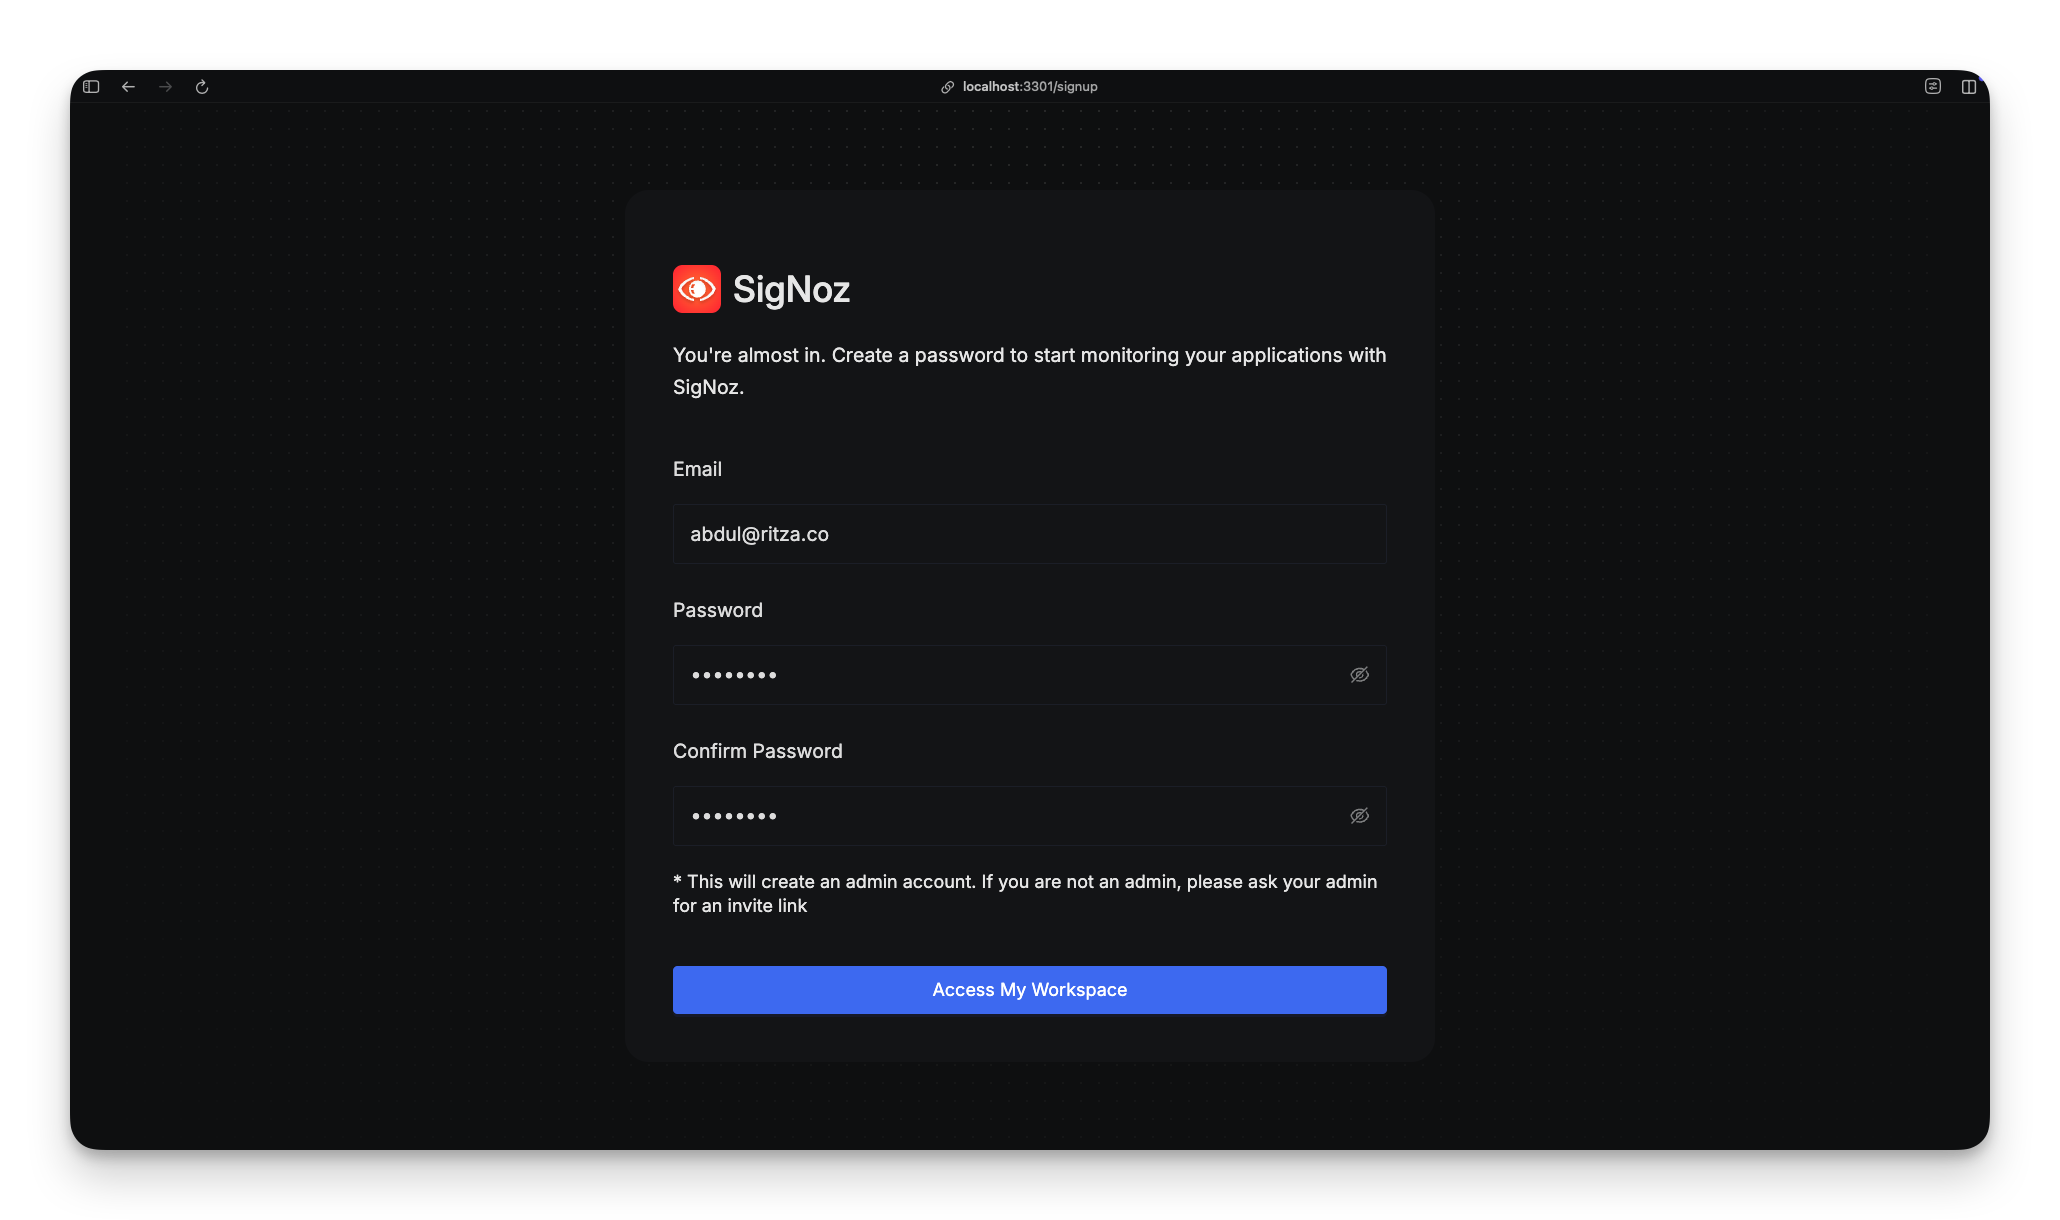
No account creation. No API keys. No "choose your installation method" page with sixteen tabs. It asks for a name and email (which you can make up), and you're in.
The grocery app is already configured to send OpenTelemetry traces to localhost:4317, where SigNoz is listening. Refreshing the dashboard shows the grocery-api service with request traces flowing in. No configuration needed. It just worked.
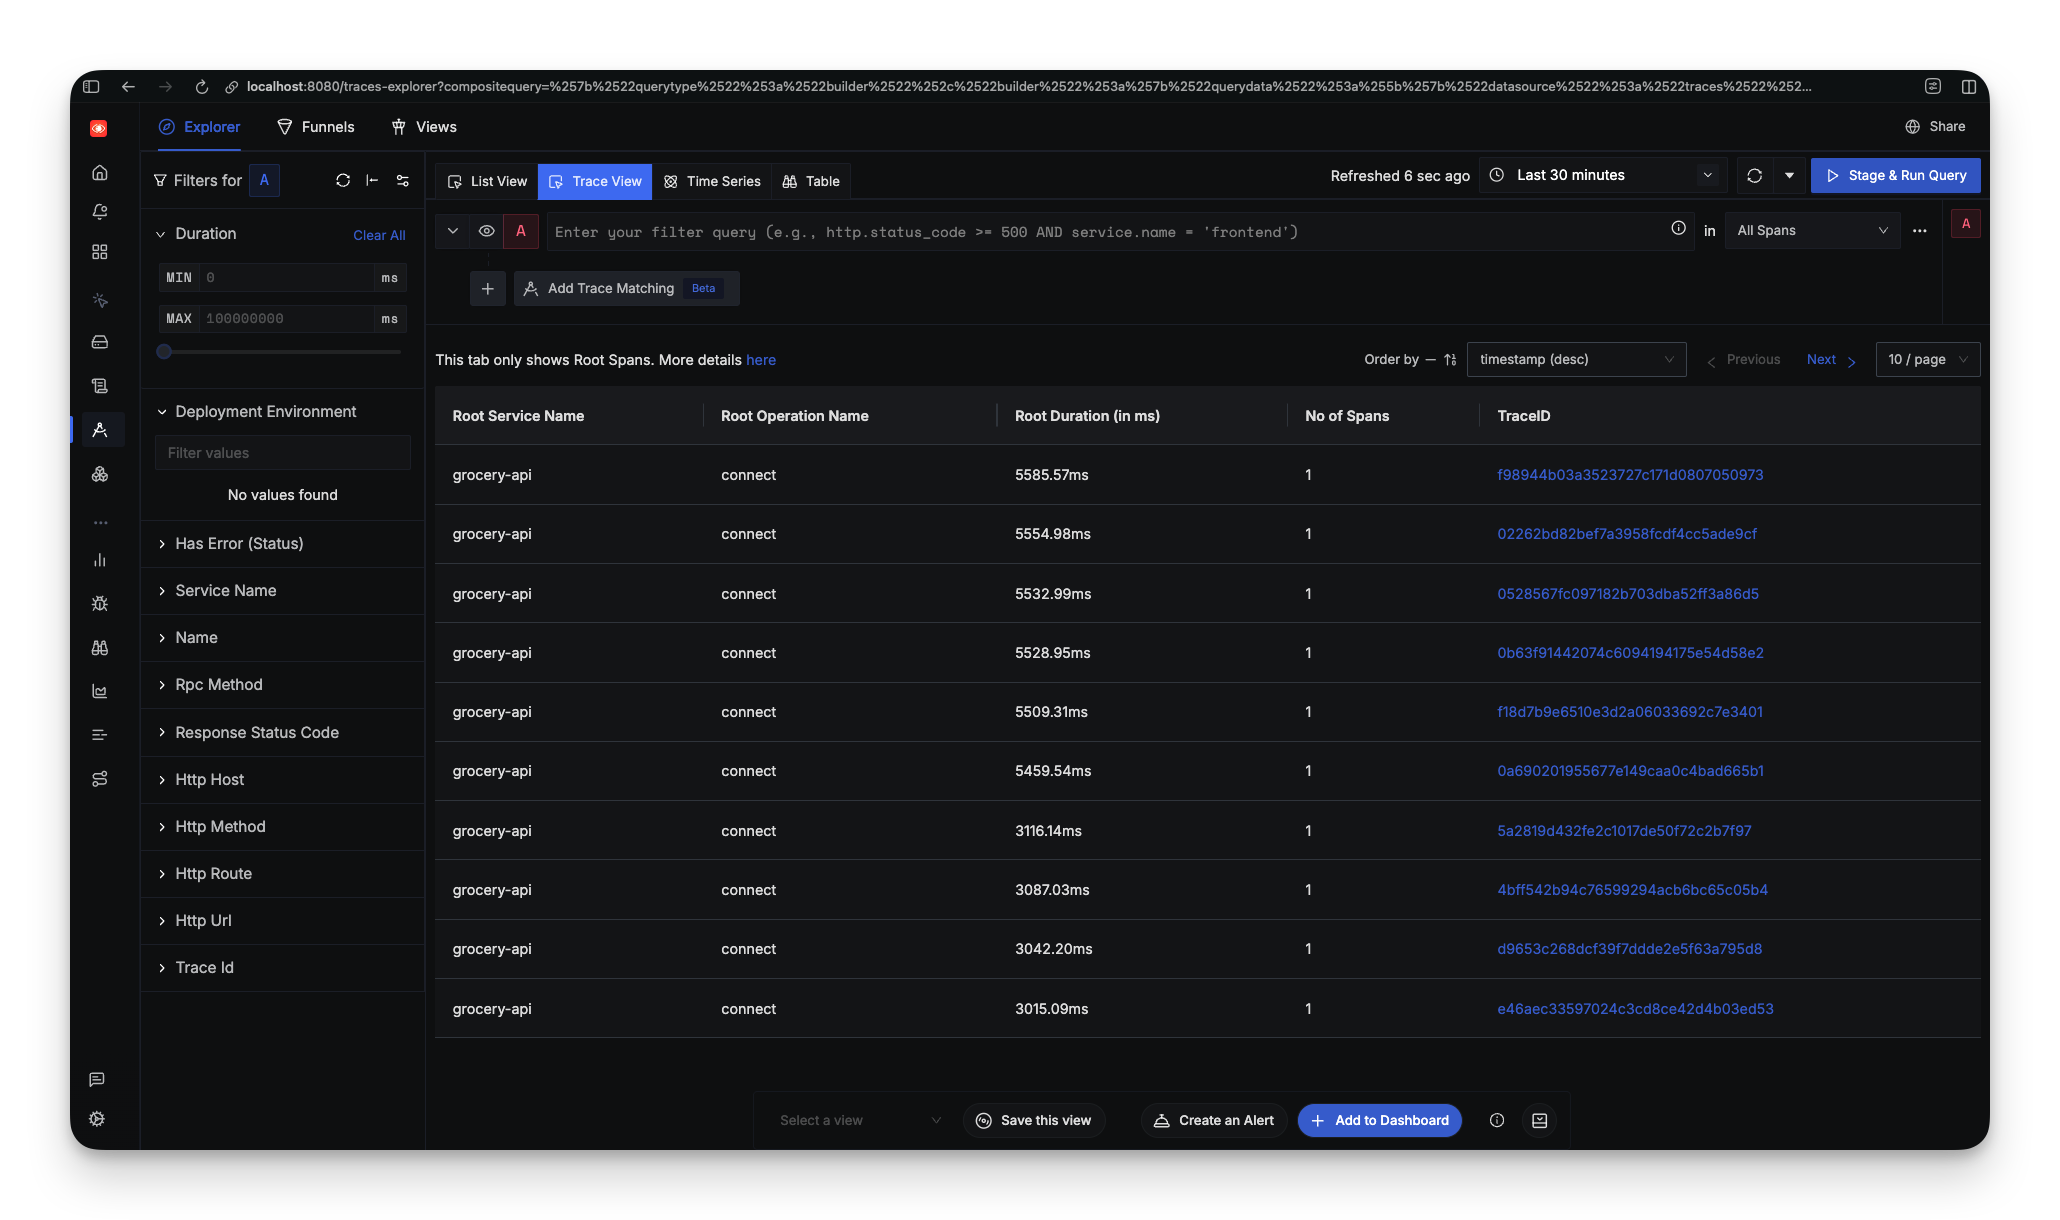
Within seconds, you can see request latency, throughput, and error rates. Click into a trace and you get a flamegraph showing exactly where time is spent.
This is what "batteries included" means. SigNoz assumes you want the simplest path and delivers it. For developers who just need to see what's happening in their app, this works.
Round 2: DataDog
SigNoz was almost too easy. Every DevOps job posting mentions DataDog, so there must be a reason. Let's see what the enterprise option looks like.
DataDog now has a free tier: 5 hosts and 1-day metric retention, no credit card required. That's decent for learning.
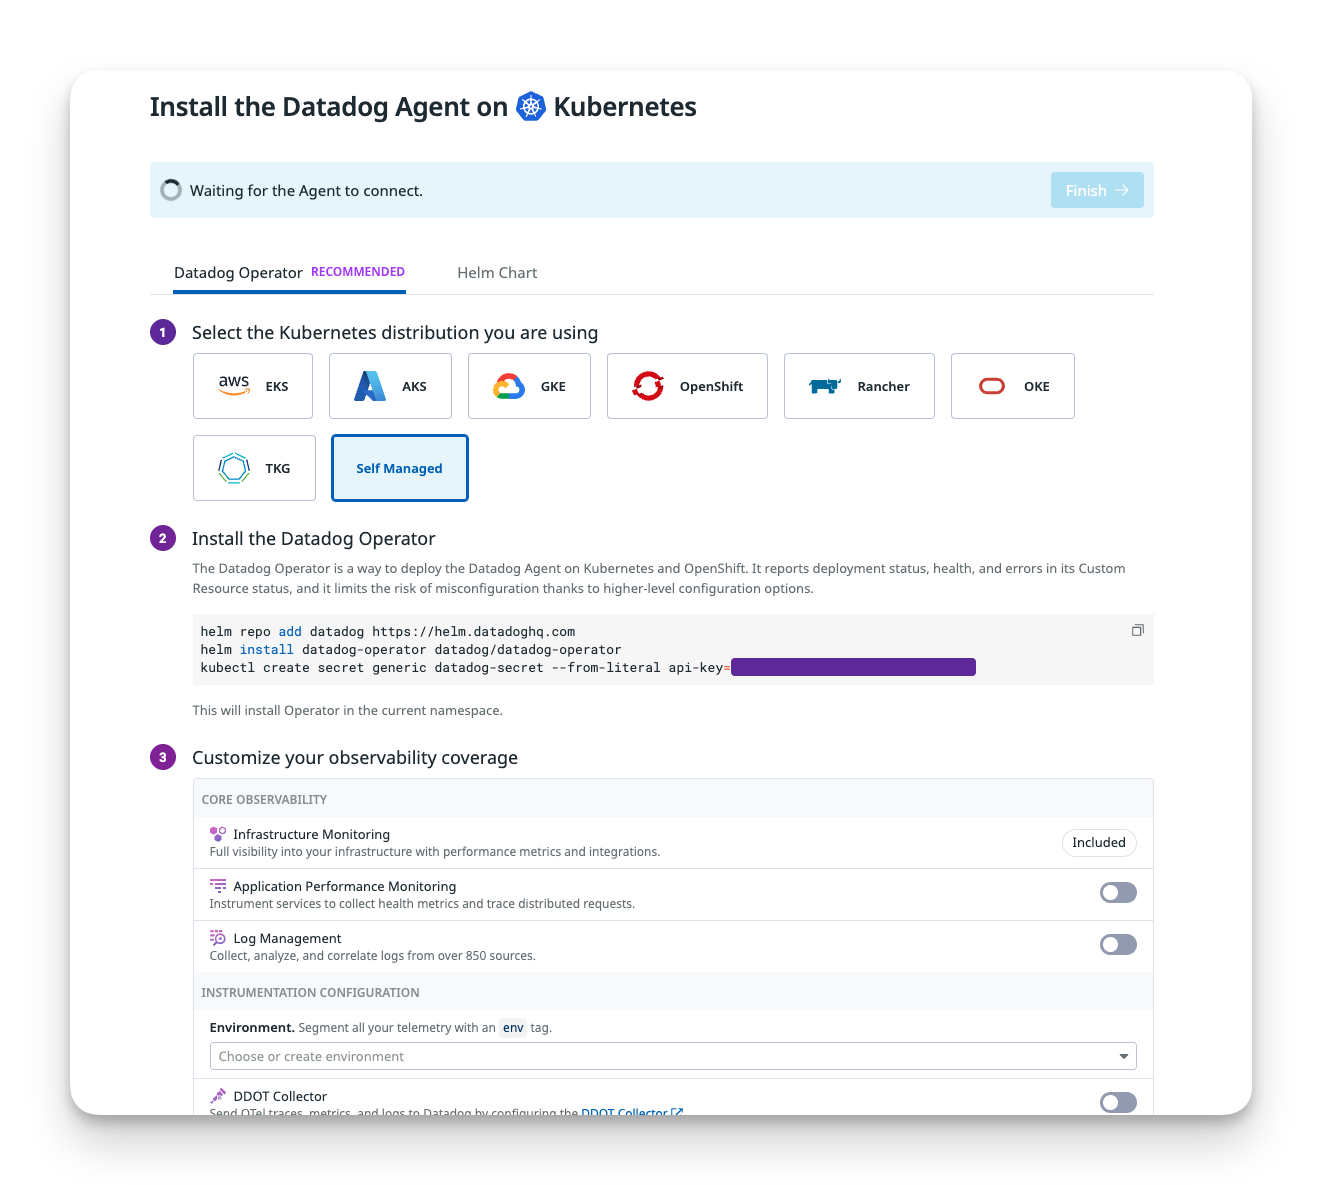
After creating an account and copying the API key, the Kubernetes installation guide immediately throws you into the deep end with "Datadog Operator" and "custom resources." Here's what it wants you to run:
helm repo add datadog https://helm.datadoghq.com
# Install the Datadog Operator
helm install datadog-operator datadog/datadog-operator
# Create secret with your API key
kubectl create secret generic datadog-secret \
--from-literal api-key=<YOUR_API_KEY>
# Deploy the DatadogAgent custom resource
kubectl apply -f datadog-agent.yaml
What's a "Datadog Operator"? Googling reveals it's a Kubernetes pattern for managing complex applications.
Then there's the config file. Remember SigNoz's ./install.sh? Here's DataDog's equivalent:
apiVersion: "datadoghq.com/v2alpha1"
metadata:
name: "datadog"
spec:
global:
site: "datadoghq.eu"
clusterName: "grocery-app-demo"
credentials:
apiSecret:
secretName: "datadog-secret"
keyName: "api-key"
kubelet:
tlsVerify: false
features:
apm:
enabled: true
hostPortConfig:
enabled: true
hostPort: 8126
logCollection:
enabled: true
containerCollectAll: true
orchestratorExplorer:
enabled: true
scrubContainers: true
liveContainerCollection:
enabled: true
admissionController:
enabled: true
mutateUnlabelled: false
This is a lot. Each feature flag is a decision you don't understand yet. What's an "orchestratorExplorer"? Should you enable "scrubContainers"? Why disable TLS verification for Docker Desktop?
The docs don't explain these things for beginners. They assume you already know.
Wait, Now We Have to Modify the App?
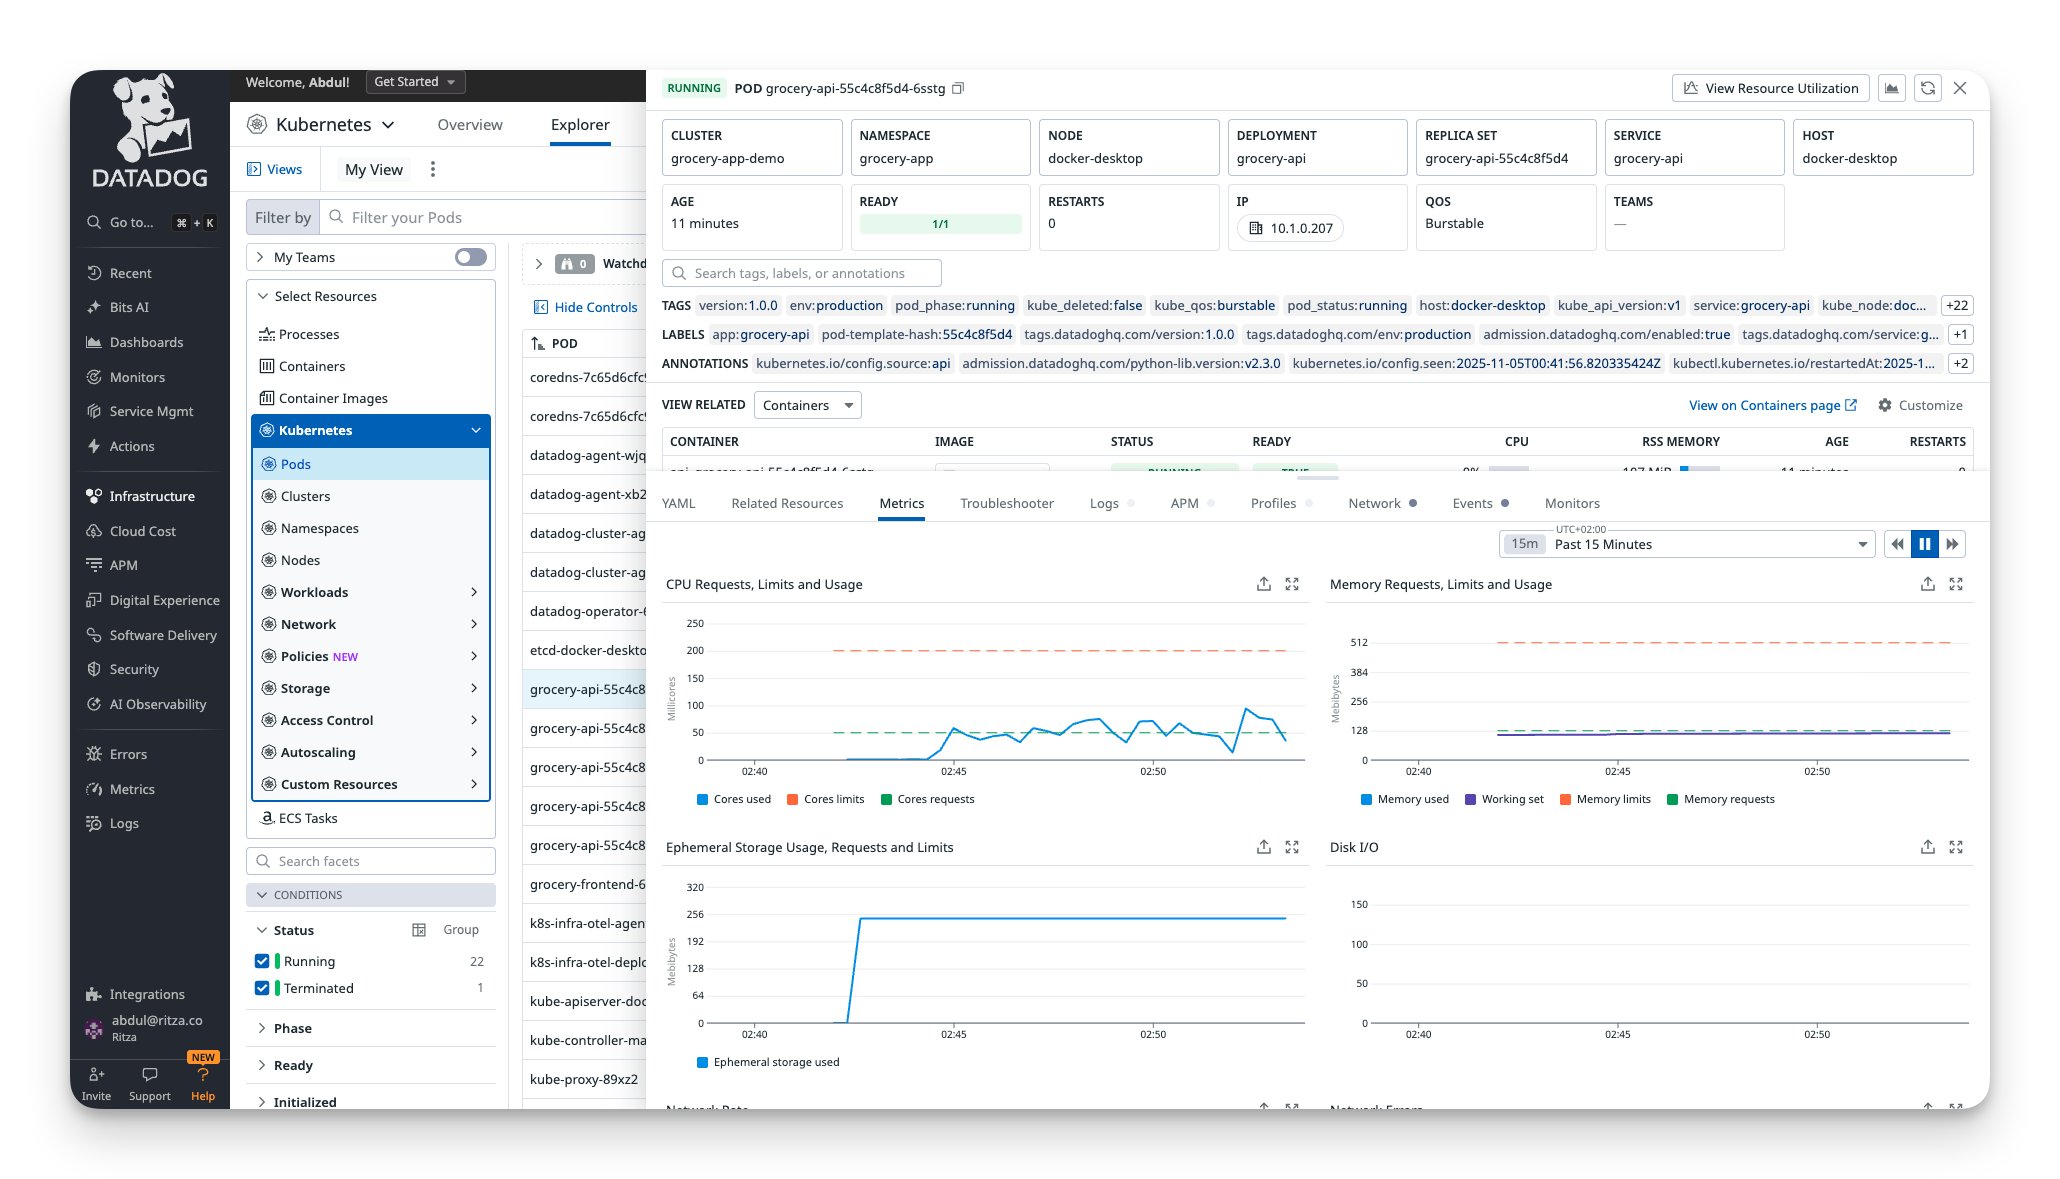
After deploying the operator, creating the secret, and applying the YAML, the agent pod starts. But nothing shows up in DataDog. The docs reveal you need to add labels and annotations to the app's deployment:
labels:
tags.datadoghq.com/service: "grocery-api"
tags.datadoghq.com/env: "production"
tags.datadoghq.com/version: "1.0.0"
admission.datadoghq.com/enabled: "true"
annotations:
admission.datadoghq.com/python-lib.version: "v2.3.0"
DataDog uses an "admission controller" that automatically injects APM libraries into your pods. It's clever. Your app doesn't need to know about DataDog; it gets instrumented at runtime. But when it doesn't work, you're debugging Kubernetes webhooks and mutating admission controllers, which isn't beginner territory.
The Error Collection
After adding the labels and redeploying, here's what broke:
Error 1: "API Key invalid, dropping transaction" The secret was created in the wrong namespace. Fixed it, restarted the agent. Still broken.
Error 2: "impossible to reach Kubelet" The agent can't talk to Kubelet because Docker Desktop uses self-signed TLS certificates. Solution: add kubelet.tlsVerify: false to the config.
Error 3: "orchestrator check is configured but the cluster name is empty" Forgot to set clusterName in the global config. Fixed that.
Error 4: "failed to send, dropping traces to http://192.168.65.3:8126 - Connection refused" The APM agent was trying to use a Unix socket but the app couldn't reach it. Solution: switch to hostPortConfig mode.
Each error meant:
- Reading agent logs (the agent pod has 4 containers)
- Googling the error message
- Finding a GitHub issue from 2021 marked "closed but not fixed"
- Trying a workaround
- Restarting everything
Twenty-five minutes into setup and you're debugging Kubernetes networking layers.
When It Finally Works
Eventually the agent deploys without errors, but the DataDog dashboard is still empty. DataDog processes everything server-side. Your cluster sends data to their infrastructure, they process it, then you see it. There's a 2-3 minute delay where you're staring at an empty screen wondering if something else broke.
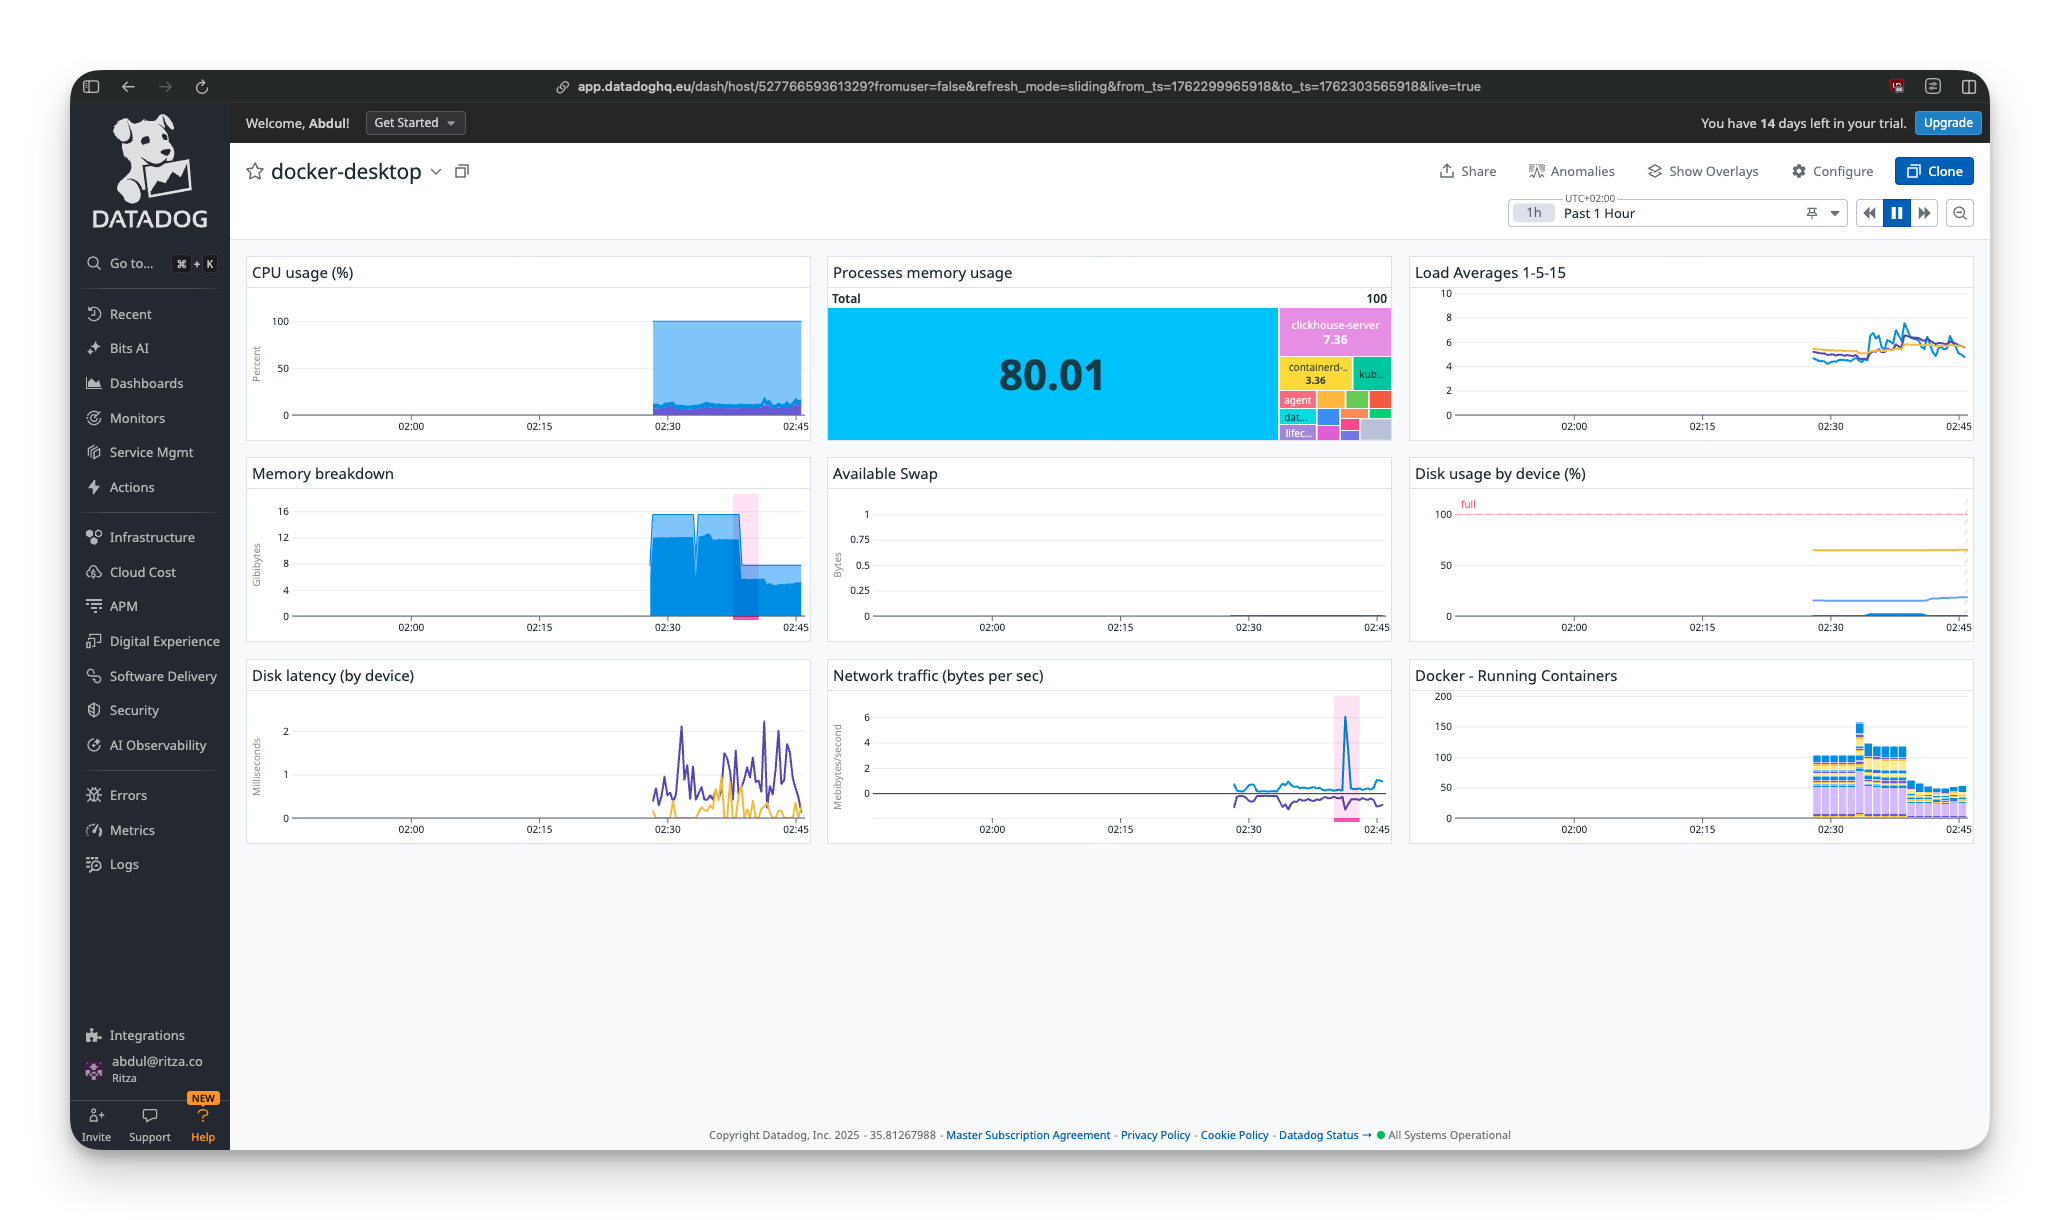
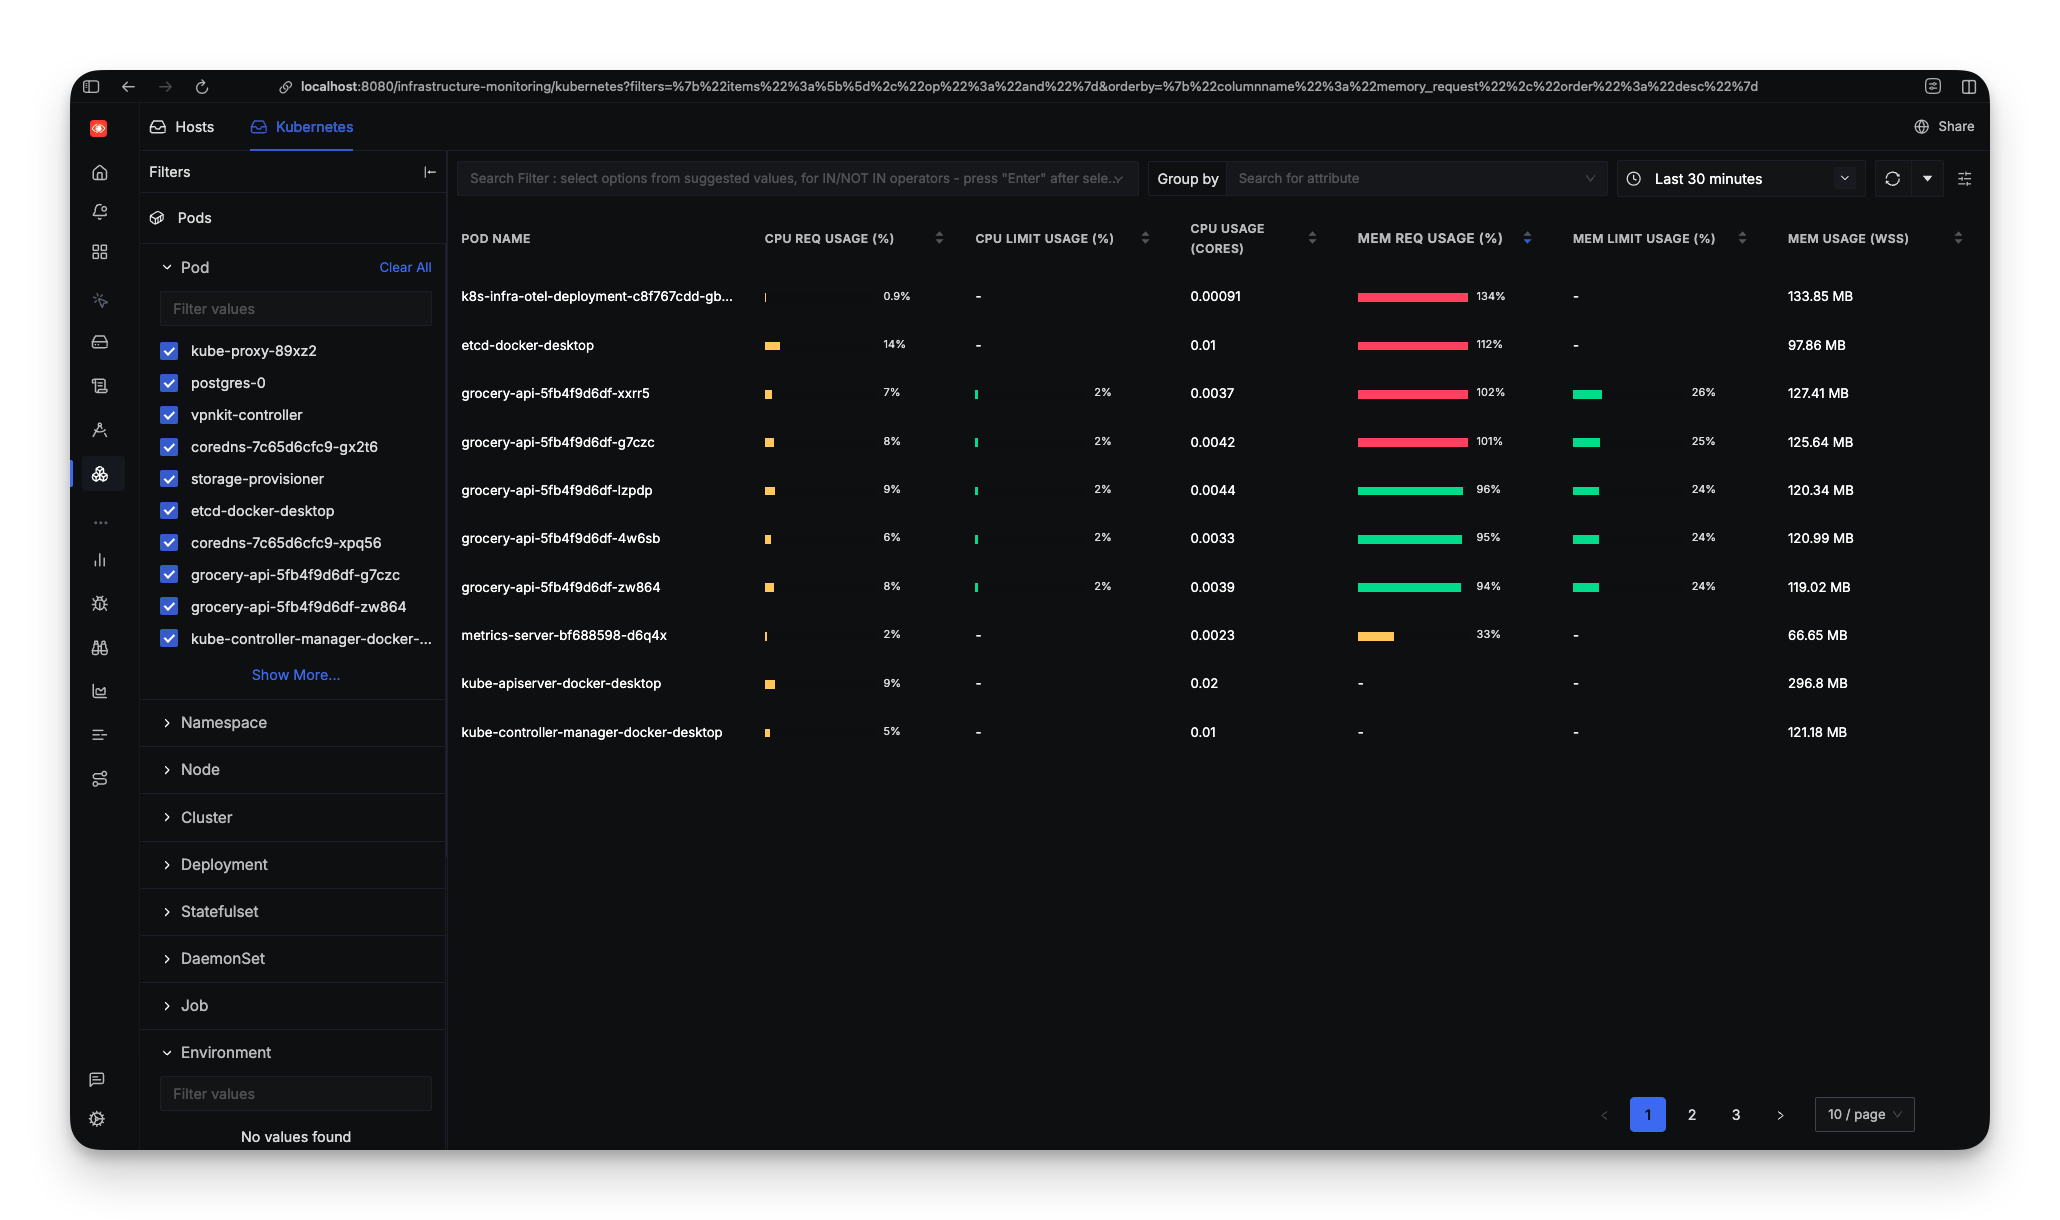
Then it appears, and it's impressive. The Infrastructure > Kubernetes view shows your cluster as a visual map: pods as hexagons, color-coded by health, organized by namespace. You can see your entire cluster topology at a glance.
The Containers view shows detailed metrics for each container, including CPU, memory, network I/O, and correlations with traces and logs.
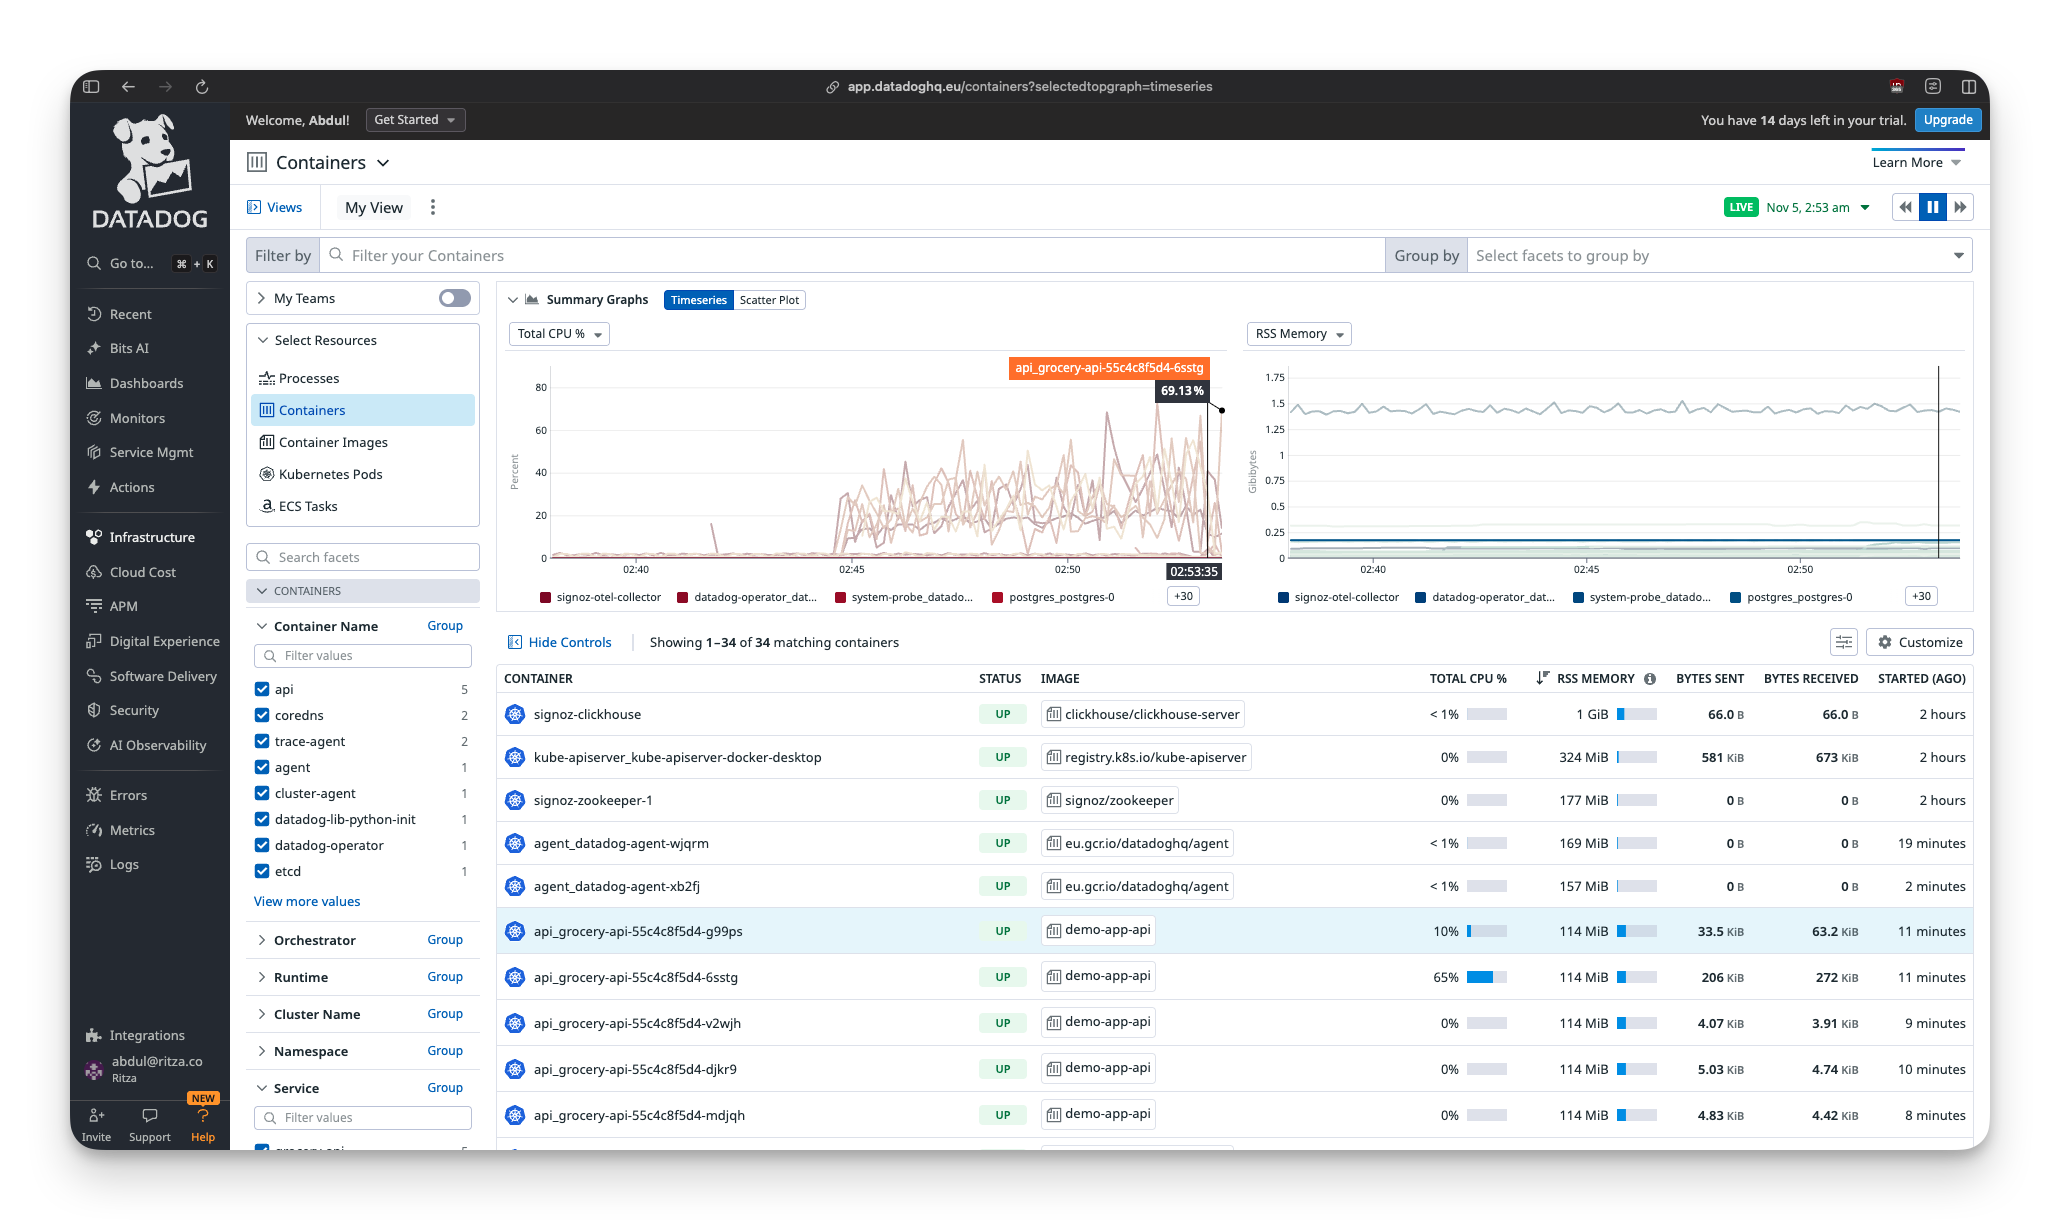
The dashboards are professional-grade. Everything is correlated. Click a pod, see its metrics, traces, and logs all in one view. This is what you pay DataDog for (or will pay for, once you exceed the free tier limits).
But navigating the UI feels like browsing a SaaS product catalog. The sidebar shows APM, RUM, Security Monitoring, CI/CD Observability, Serverless, and a dozen other categories. You want to see your Kubernetes pods, but DataDog wants to show you seventeen other products first.
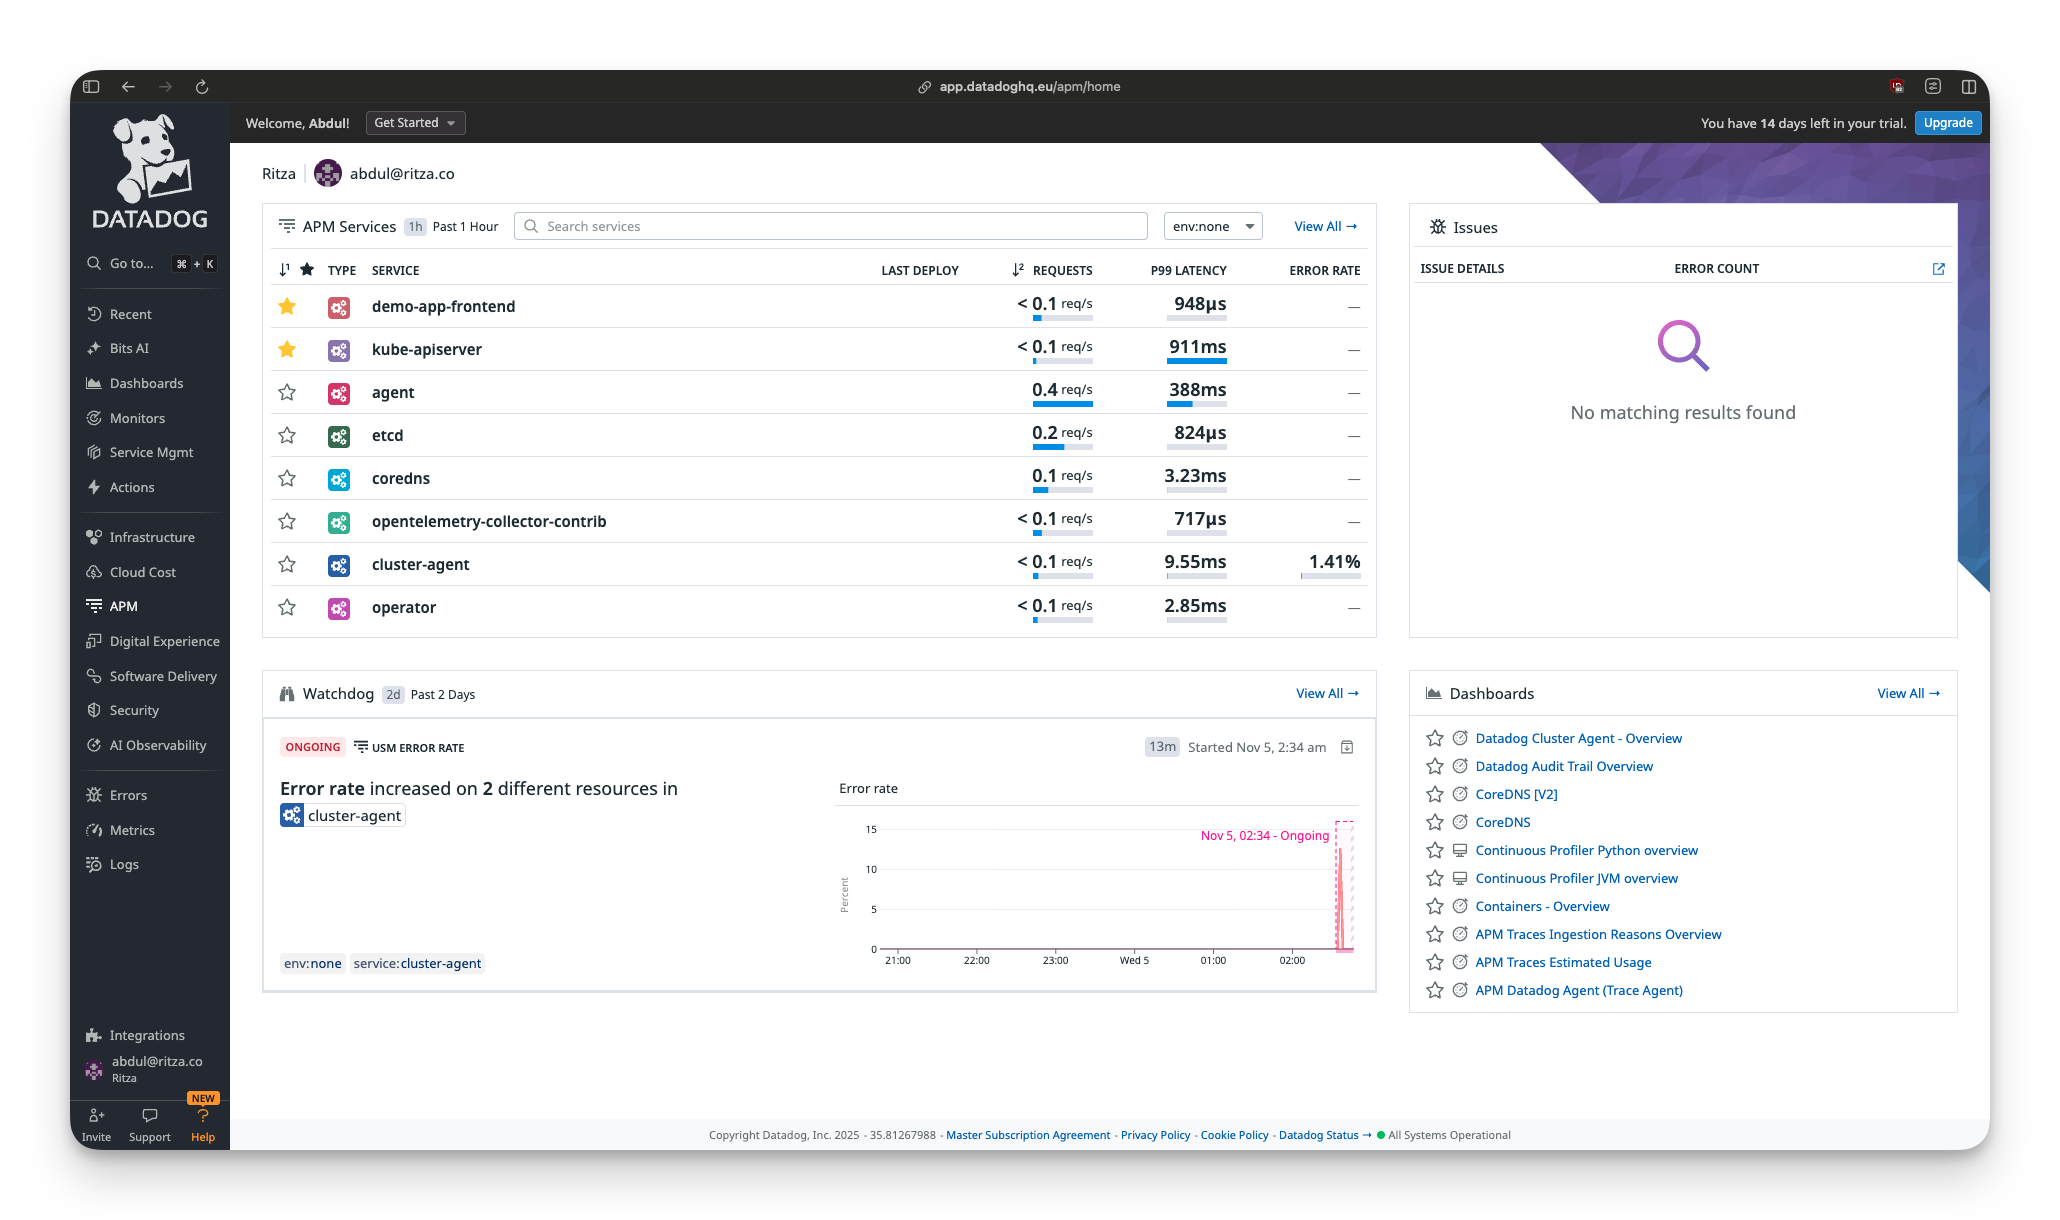
Pro tip: Use the search bar. Type "kubernetes pods" to jump directly to what you need, because clicking through menus will take you on a tour of every DataDog SKU.
Time to first metric: 20-25 minutes, including account setup, operator installation, debugging four different errors, and waiting for data to appear.
Is it worth it? If you're at a company that already uses DataDog, yes. Everything integrates. If you're a solo developer learning Kubernetes monitoring, the setup complexity is rough.
Round 3: Grafana Cloud
Third platform. Grafana is the "power user" option: maximum flexibility, generous free tier, industry standard for metrics. Plus, r/homelab loves it. Let's see if flexibility means "powerful" or just "complicated."
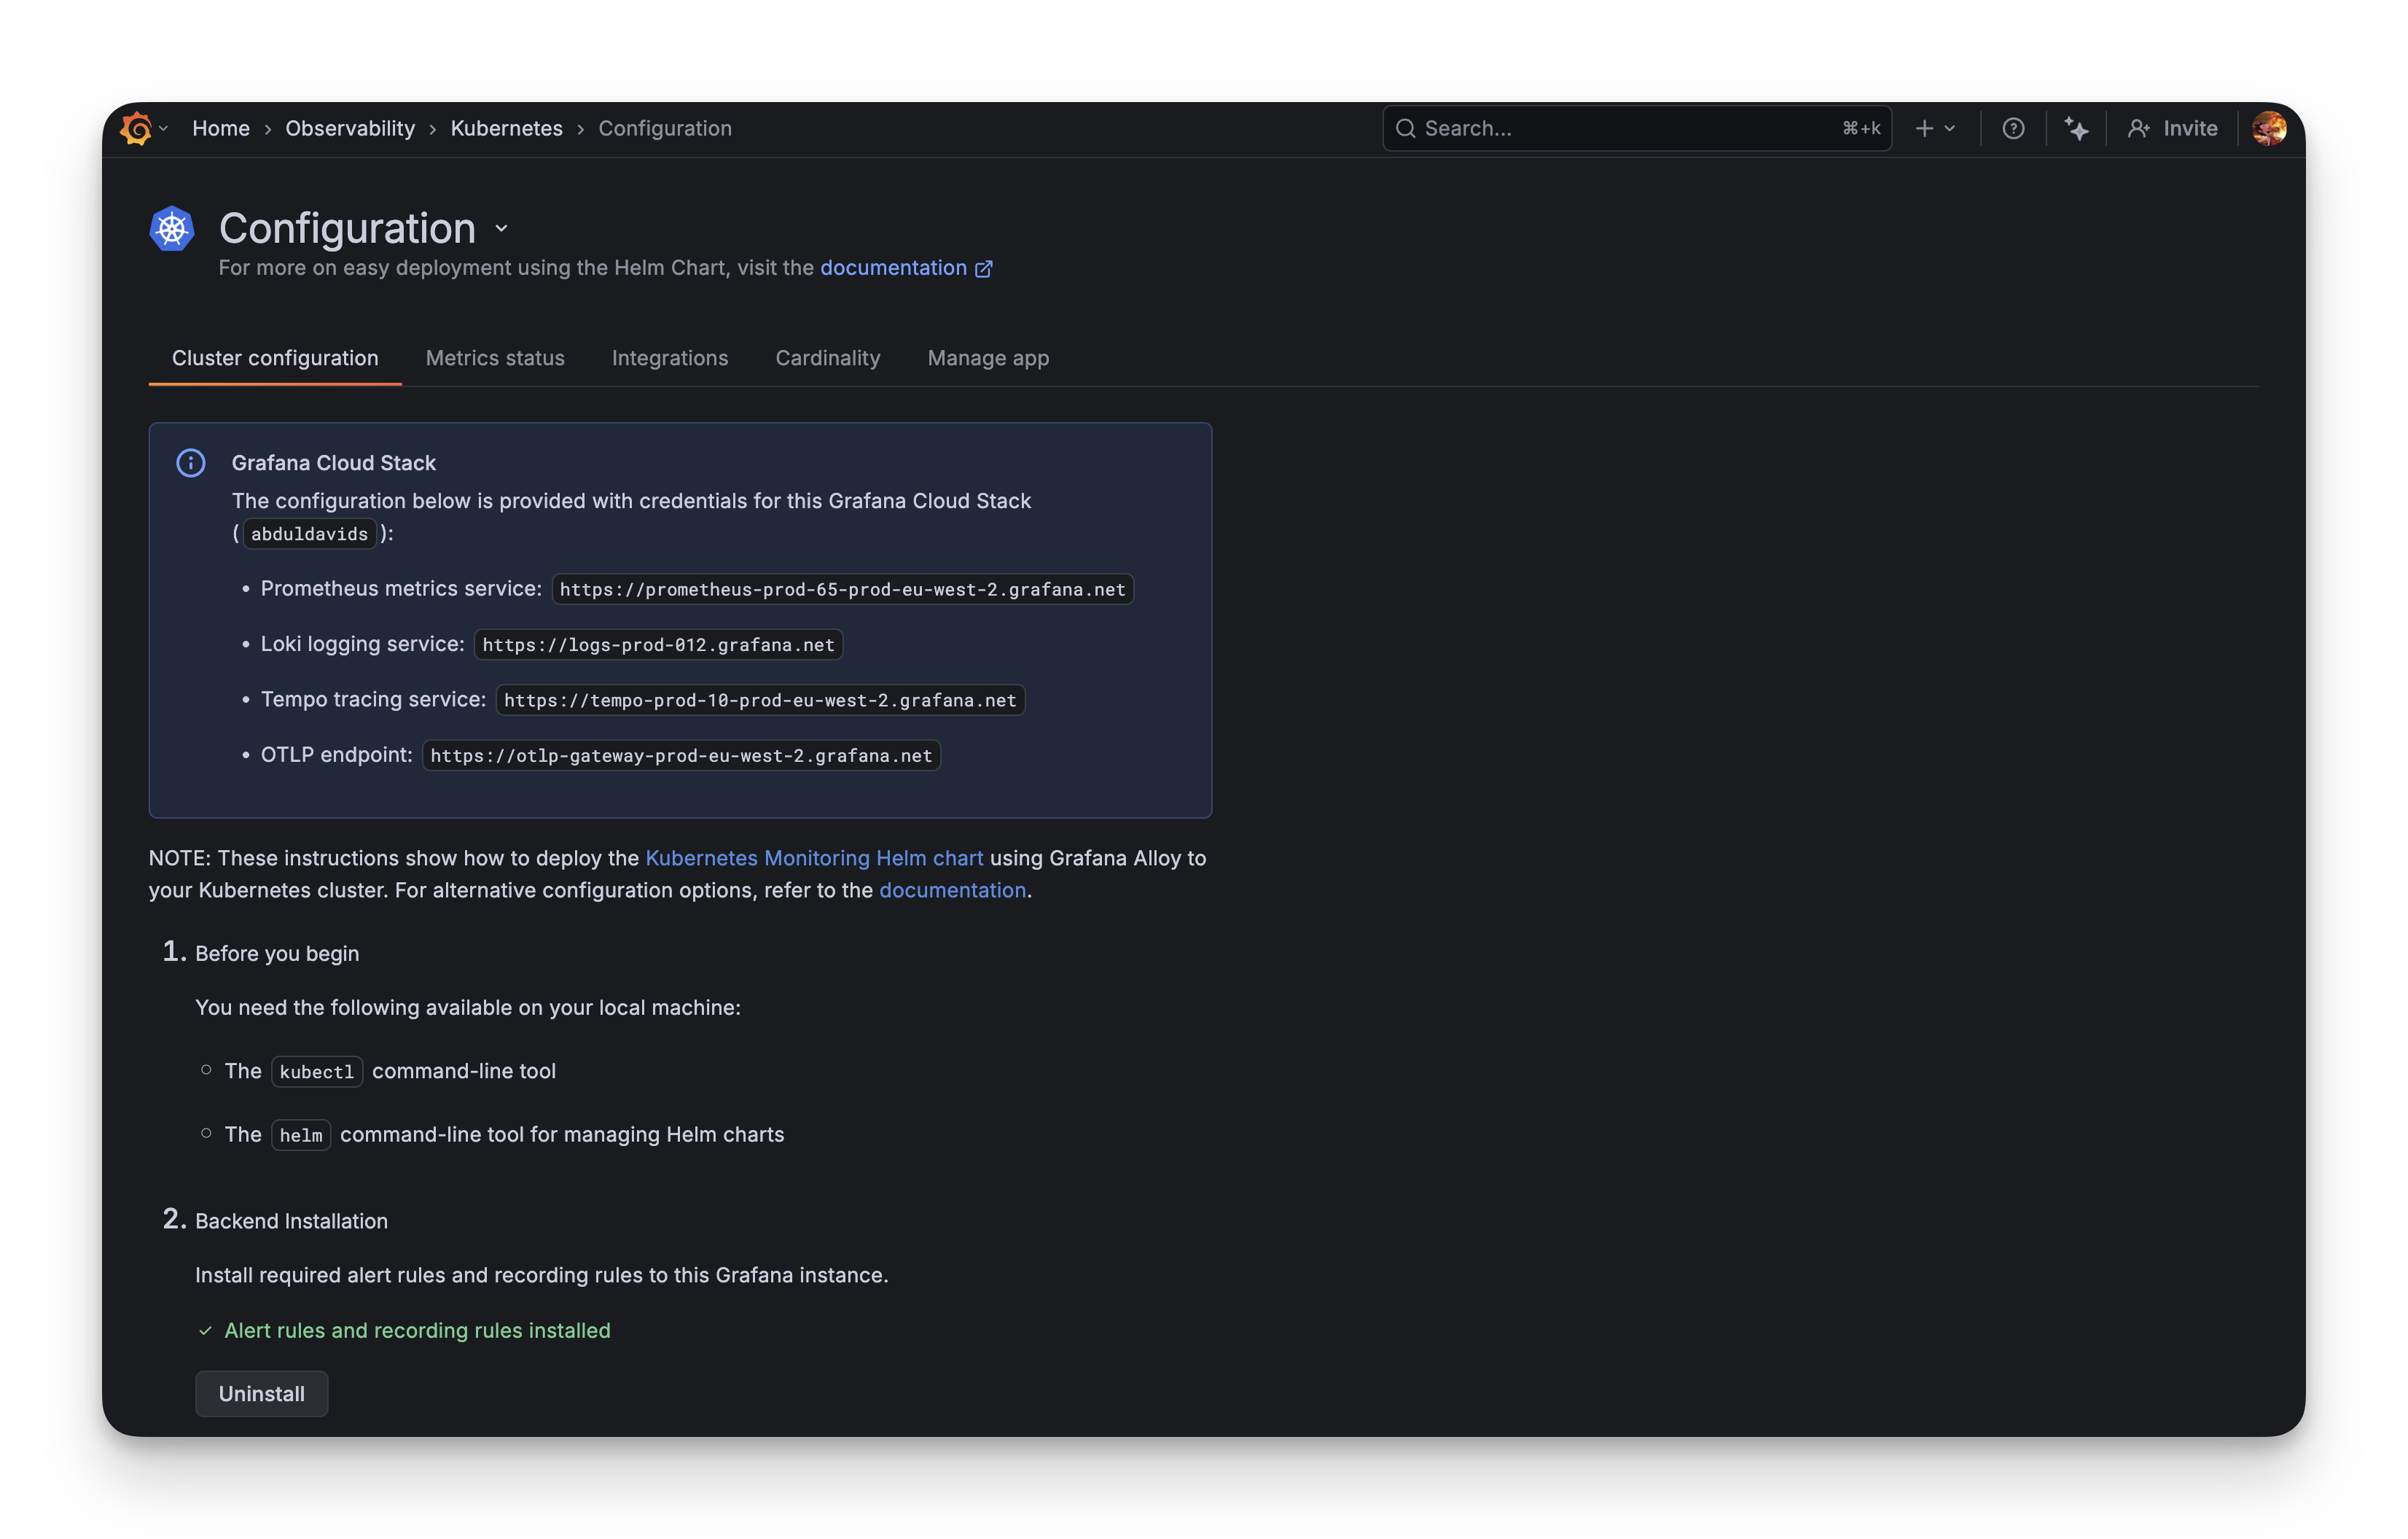
After signing up for Grafana Cloud (free tier: 10k metrics, 50GB logs, 50GB traces) and navigating to the Kubernetes Monitoring integration, it wants you to deploy "Grafana Alloy," their new OpenTelemetry-based collector.
The Configuration Generator
The Grafana Cloud UI has a configuration wizard. You check boxes for what you want:
- Cluster metrics (yes)
- Pod logs (sure)
- Application observability (sounds good)
- Cost metrics (why not)
- Energy metrics (wait, what?)
Hit "Generate" and Grafana spits out a Helm command with over 200 lines of YAML configuration:
- Multiple Alloy instances (metrics, logs, singleton, receiver)
- OpenCost for cost tracking
- Kepler for energy metrics
- kube-state-metrics
- Node Exporter
This is comprehensive and somewhat intimidating. The UI says "copy and run this," so that's what you do.
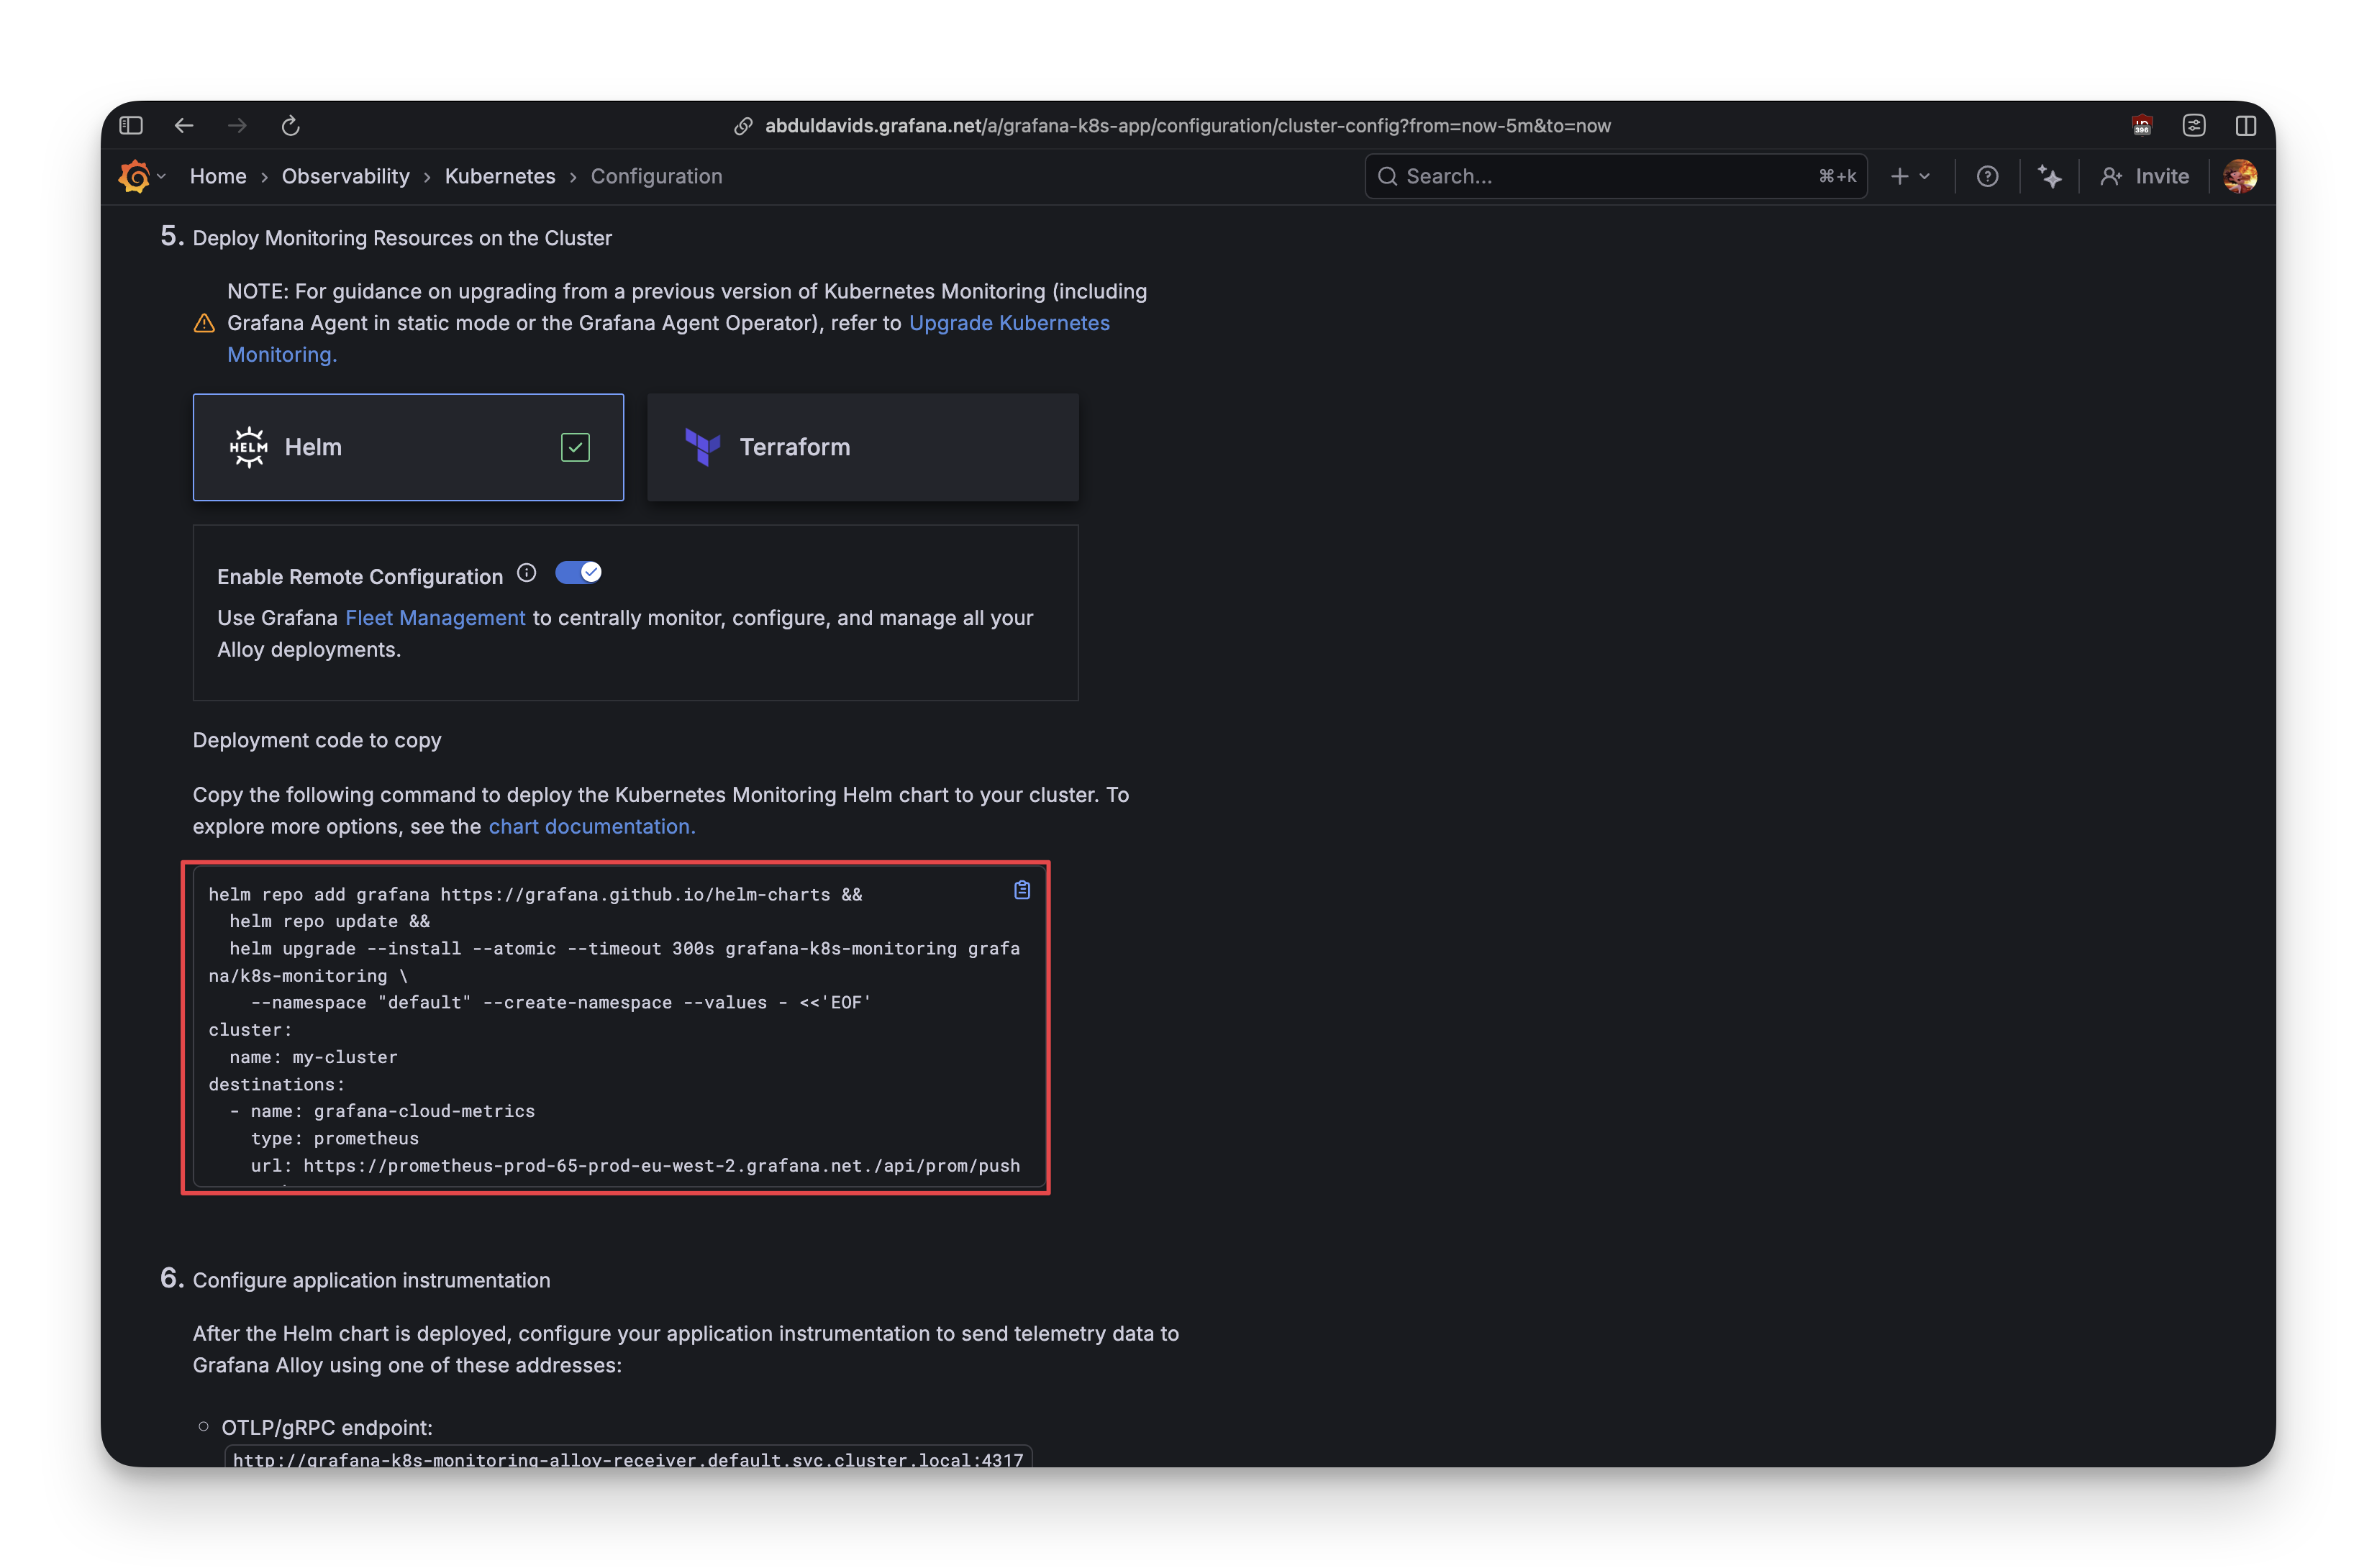
helm upgrade --install grafana-k8s-monitoring grafana/k8s-monitoring \
--namespace default --create-namespace --values grafana-values.yaml
After running it, Helm starts pulling images and deploying components. Three minutes later, kubectl get pods -n default shows 8 new components running:
Much easier than DataDog.
What Actually Works
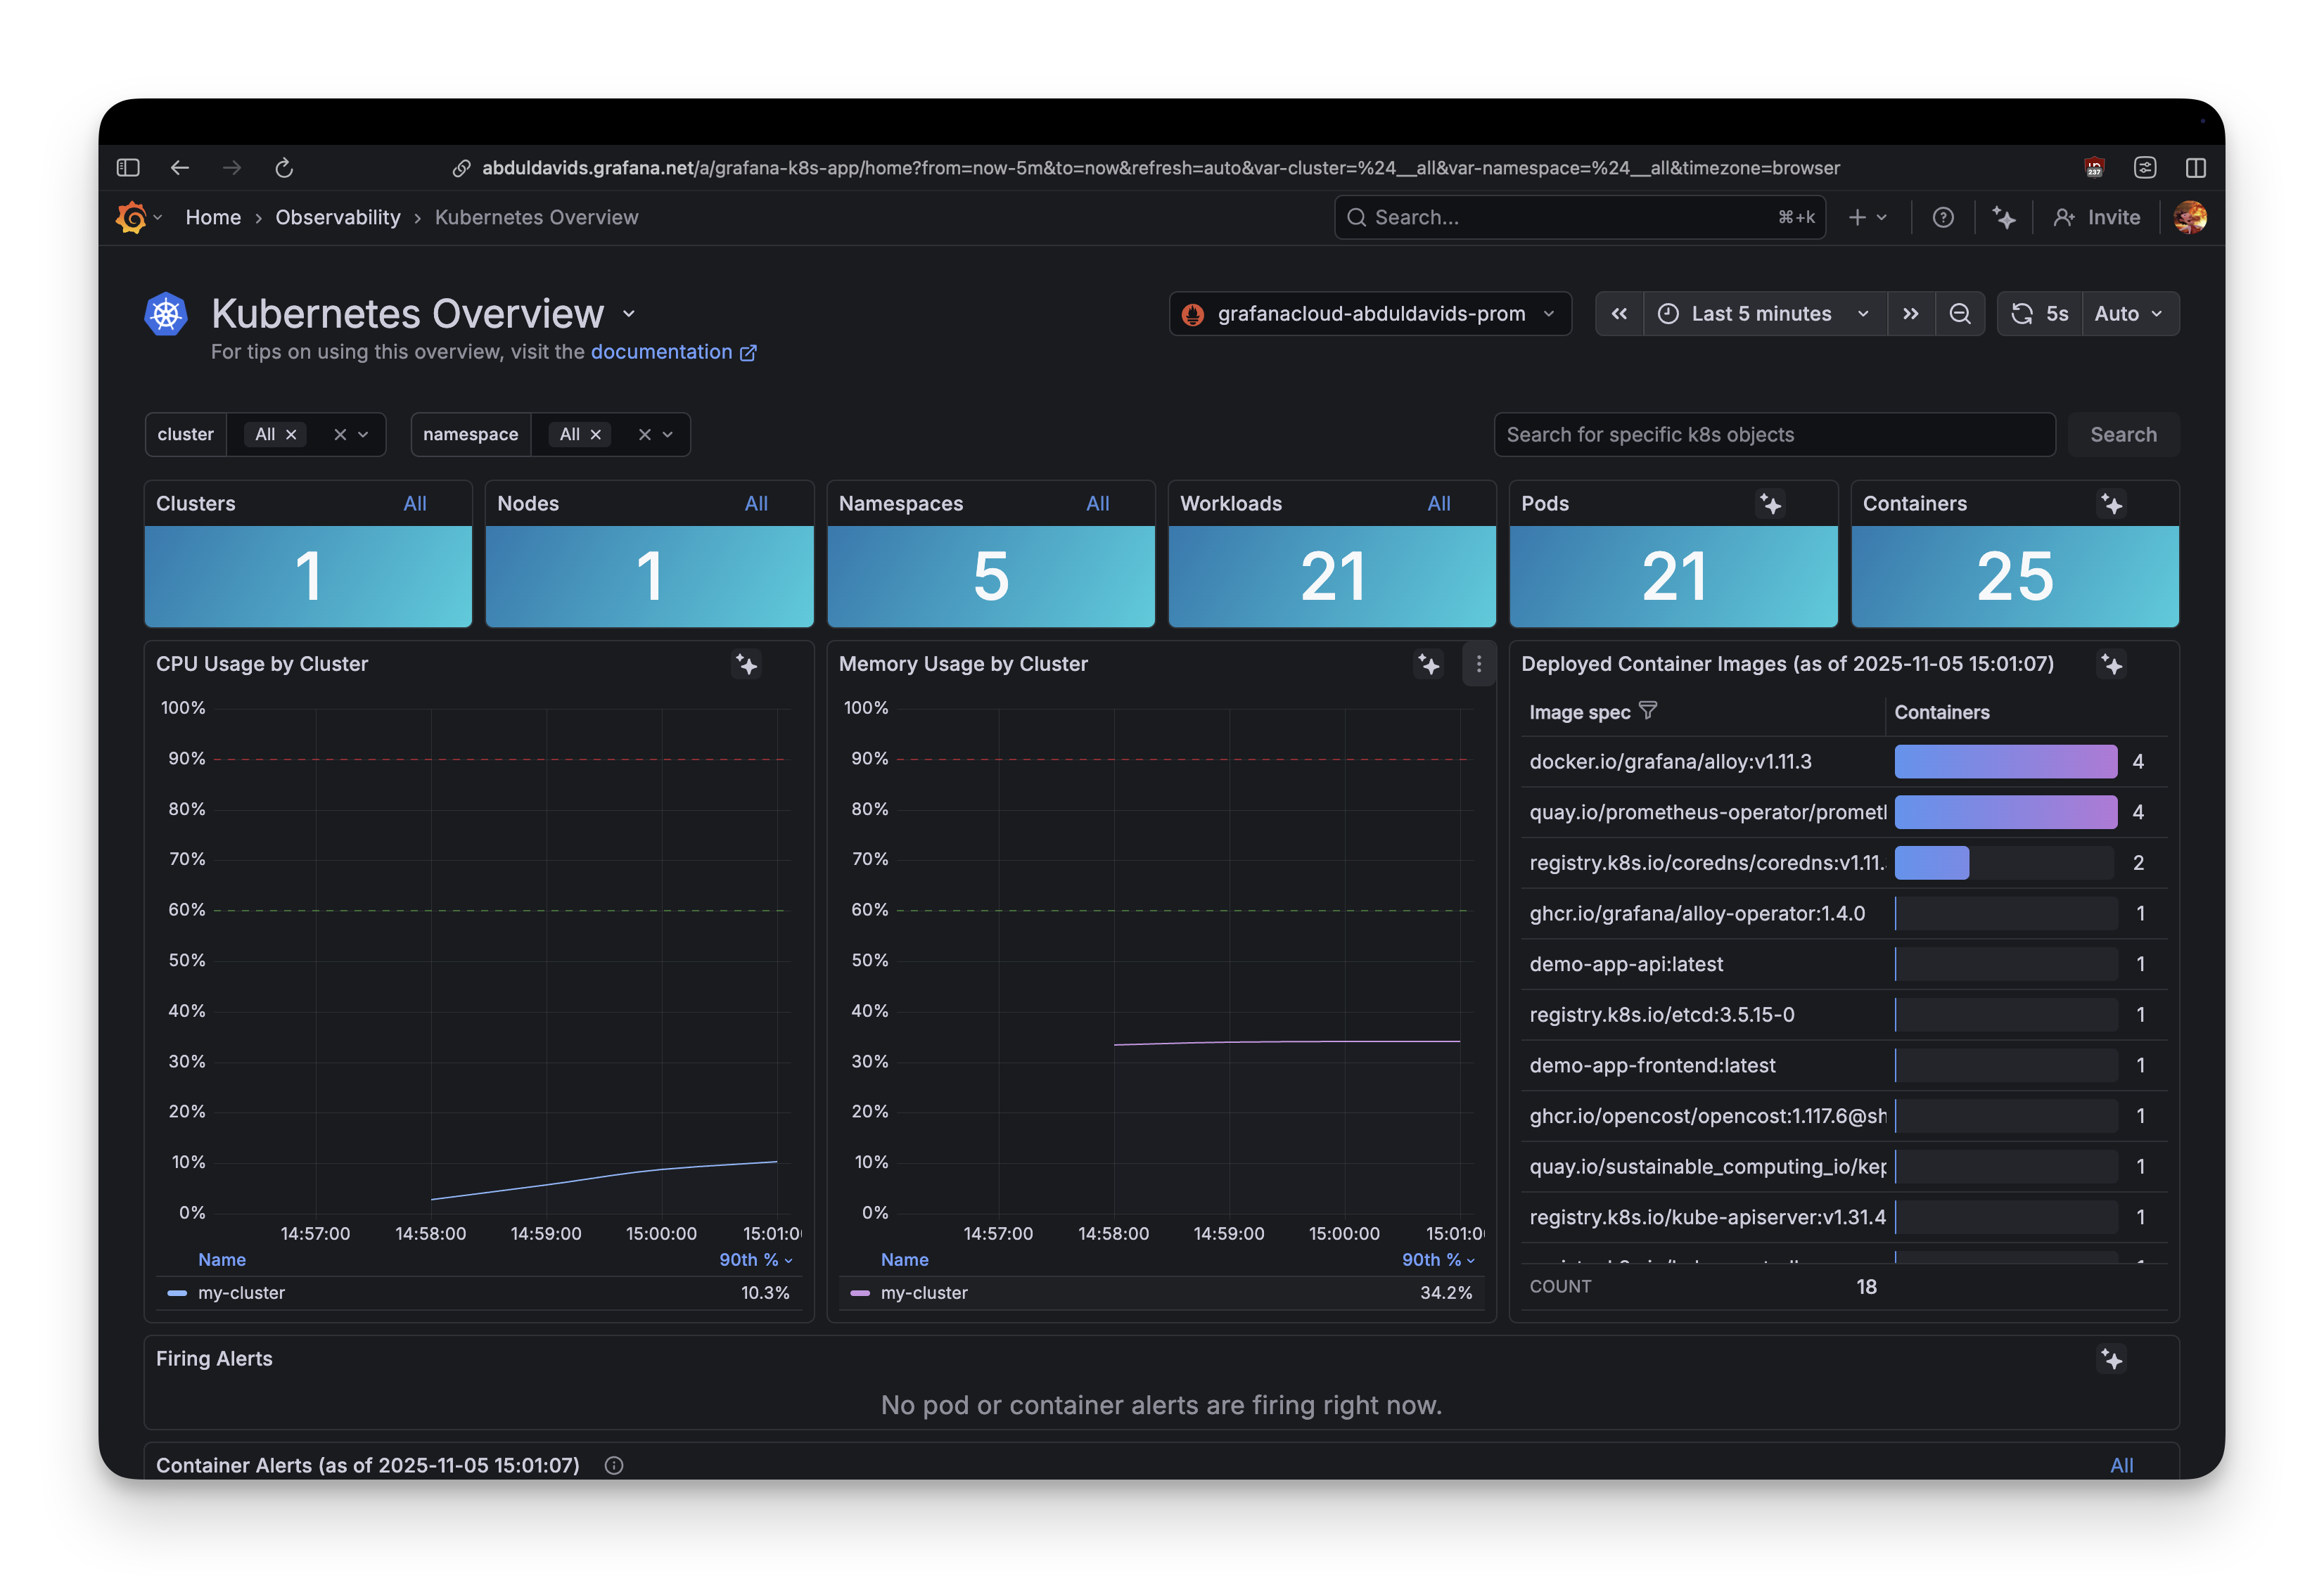
Opening Grafana Cloud and navigating to Explore, within 30 seconds you can see:
- Cluster metrics (CPU, memory, pod counts) flowing to Prometheus
- Pod logs automatically discovered and streaming to Loki (their log aggregation system)
- Kubernetes events showing when pods scale up/down
The logs collection is excellent. Type {namespace="grocery-app"} into Loki and every log line from every pod appears. No configuration needed.
This is what Grafana does well: infrastructure observability that works out of the box.
What Doesn't Work: The Traces That Never Arrived
Application traces are a different story.
After deploying the app, the Flask app is configured to send OpenTelemetry traces to the Alloy receiver:
OTEL_TRACES_EXPORTER: "otlp"
After redeploying and checking the Alloy receiver logs (listening on port 4317), testing DNS resolution (works), and confirming the endpoint is reachable (yes), everything looks correct.
No traces appear in Tempo.
After 20 minutes of debugging (adding manual OpenTelemetry initialization code, removing SQLAlchemy instrumentation), still no traces.
Eventually, a GitHub issue surfaces: Python OpenTelemetry auto-instrumentation doesn't play nice with gunicorn (the WSGI server Flask uses in production). This isn't Grafana's fault, but as a beginner, you don't know that. You're staring at empty dashboards wondering what broke.
The docs don't help. They throw around terms like "OTLP gRPC receiver," "batch processor," and "remote write endpoint" without explanation. For someone new to observability, this might as well be a foreign language.
Okay, But Can We Actually See the Pods Scaling?
This is the real test. Turn on the load generators: 100 requests per second hitting the API. The HorizontalPodAutoscaler should kick in and scale from 1 pod to 5. Let's see how each platform shows this.
SigNoz: "Here's Your App AND Infrastructure"
SigNoz's strength is that it handles both application and infrastructure monitoring in one clean interface. When you open the dashboard, you see the grocery-api service with latency, request rate, and error rate?all generated from traces. You can drill down into individual traces to see a flamegraph showing exactly how much time is spent in a database query versus application logic.
The Infrastructure tab shows a complete view of your Kubernetes cluster: pod counts, CPU usage, memory consumption, and resource utilization across nodes.
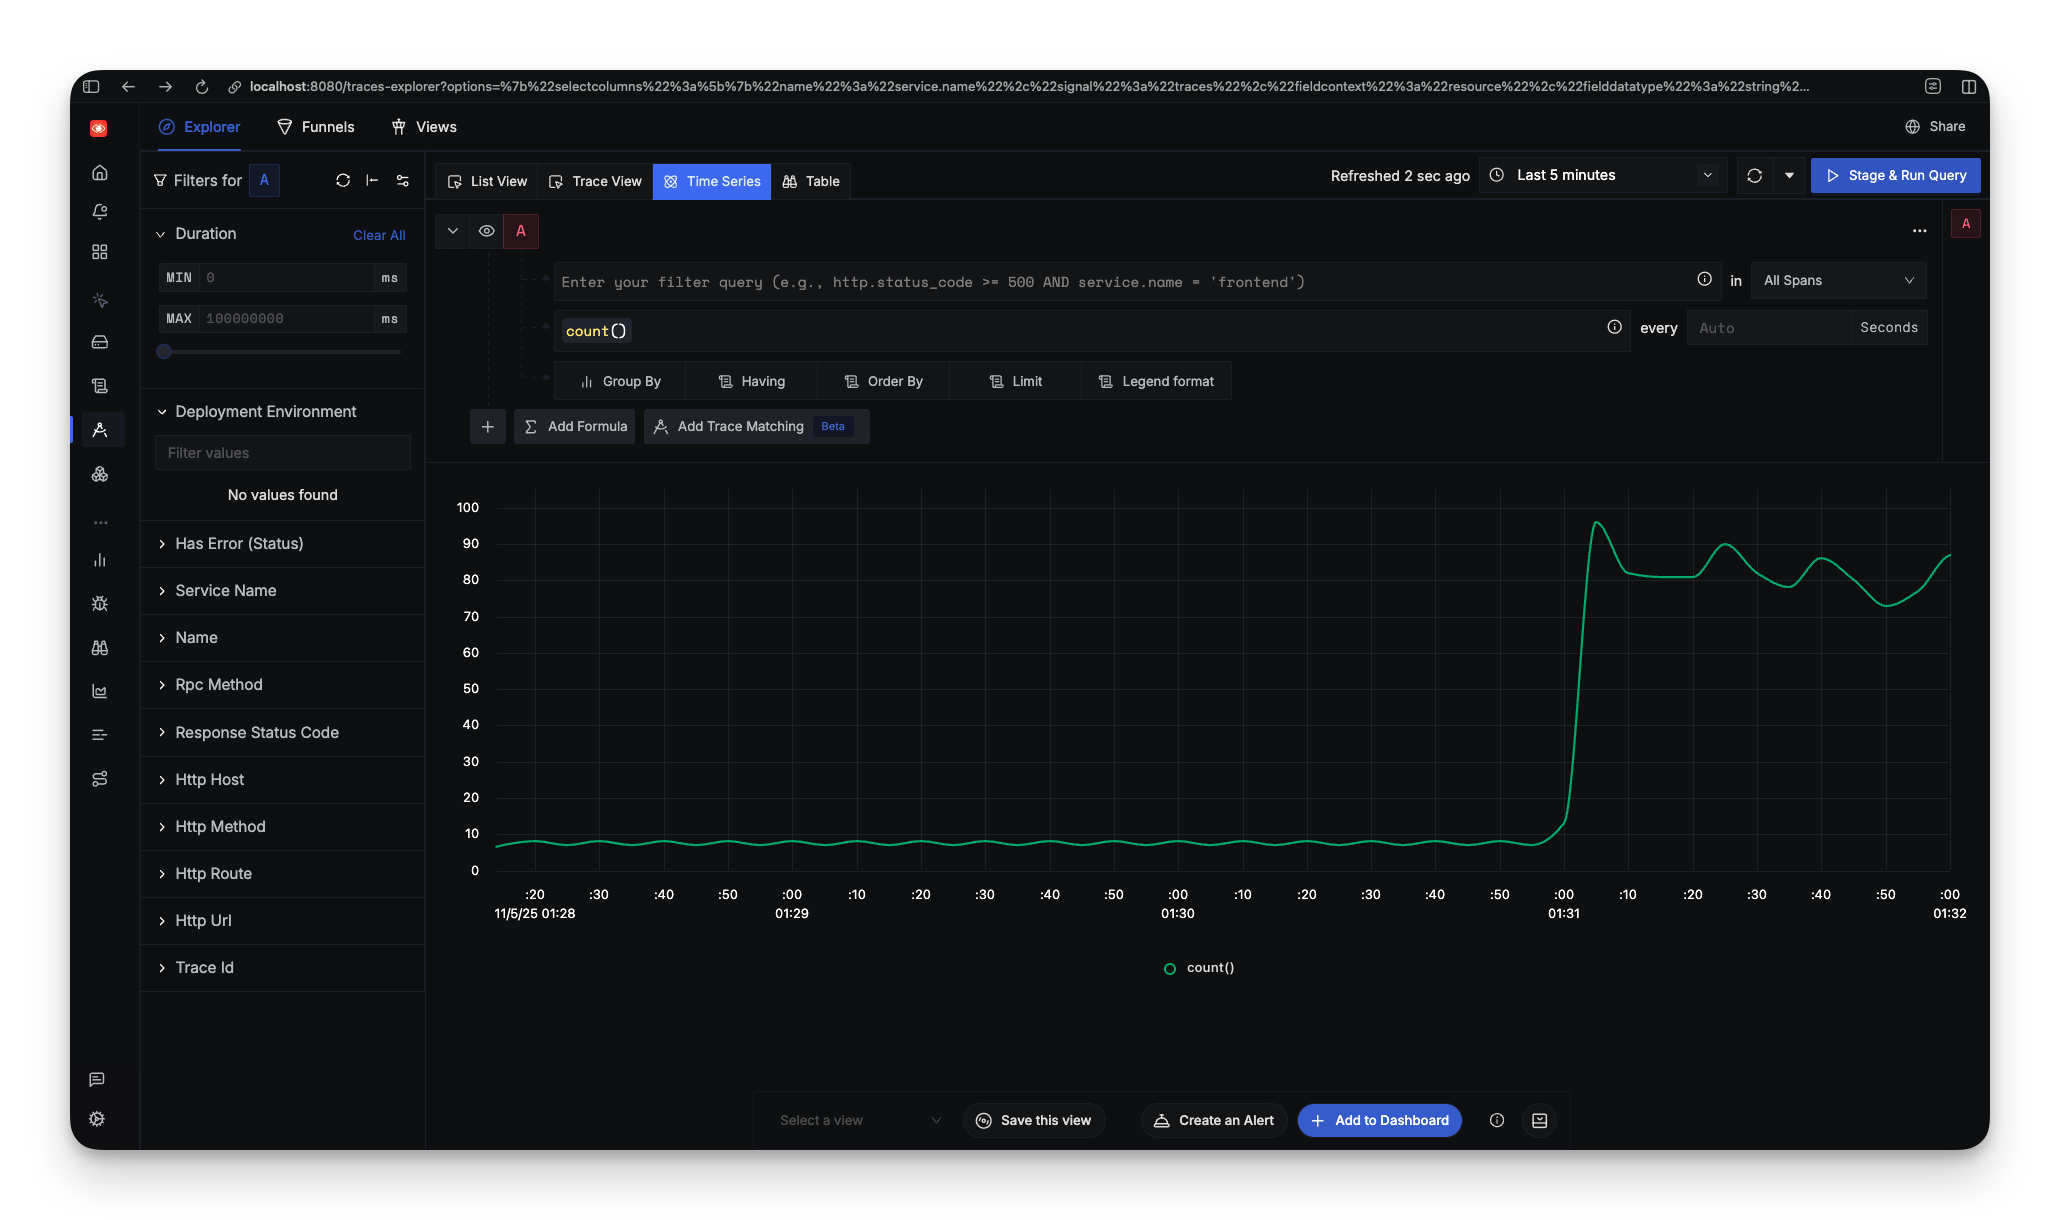
When the load generators turned on and CPU spiked to 200%, the HPA kicked in and scaled the API from 1 pod to 5. In SigNoz's infrastructure view, this happened in real-time: replica counts increasing, CPU per pod dropping as load distributed, memory patterns stabilizing as the cluster reached equilibrium.
The setup for infrastructure monitoring requires adding an OpenTelemetry collector to your Kubernetes cluster to scrape metrics and send them to SigNoz. It's an extra step beyond the basic ./install.sh, but once configured, you get the full picture: application traces, infrastructure metrics, and their correlation?all in one dashboard.
DataDog
The Orchestrator Explorer shows 317 cached Kubernetes objects with full details:
- Pod status and resource usage
- Deployment replica counts
- Service endpoints
- Full YAML manifests for every resource
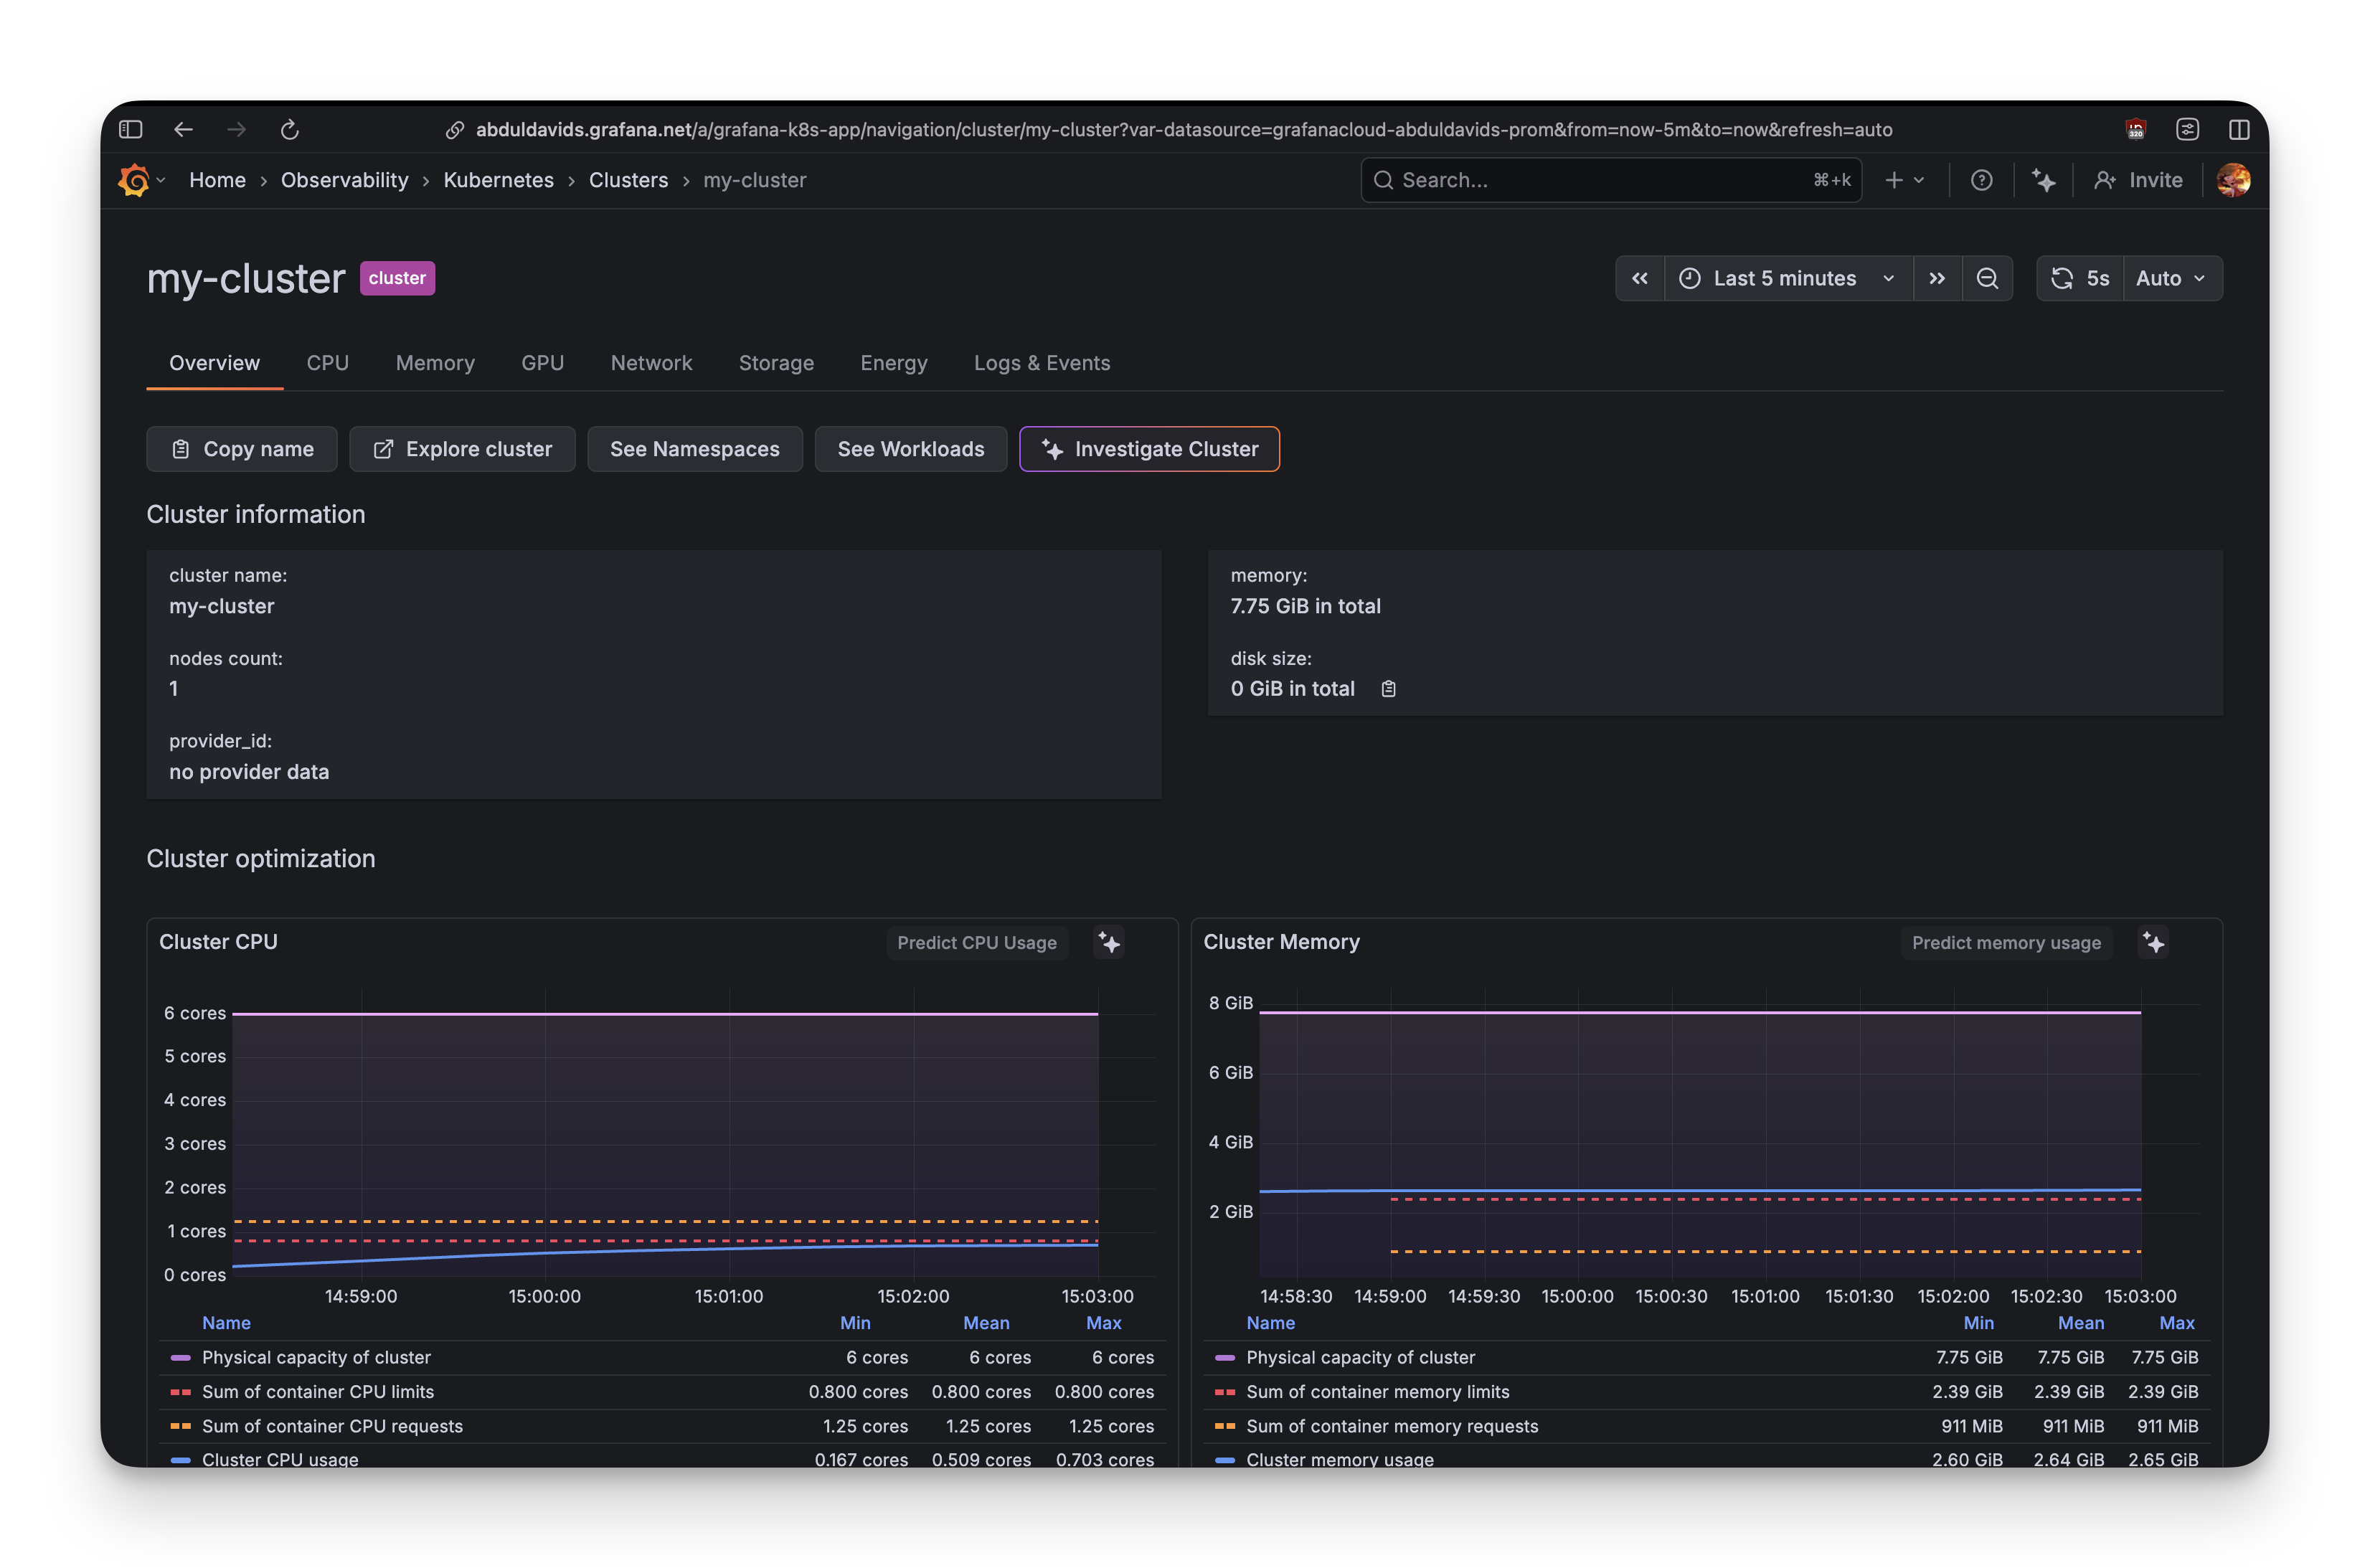
Grafana Cloud: "Learn PromQL or Die Trying"
Grafana Cloud shows cluster metrics immediately. Navigating to Observability -> Kubernetes -> Workloads, we can see a list of all the workloads in the cluster along with their pod counts.
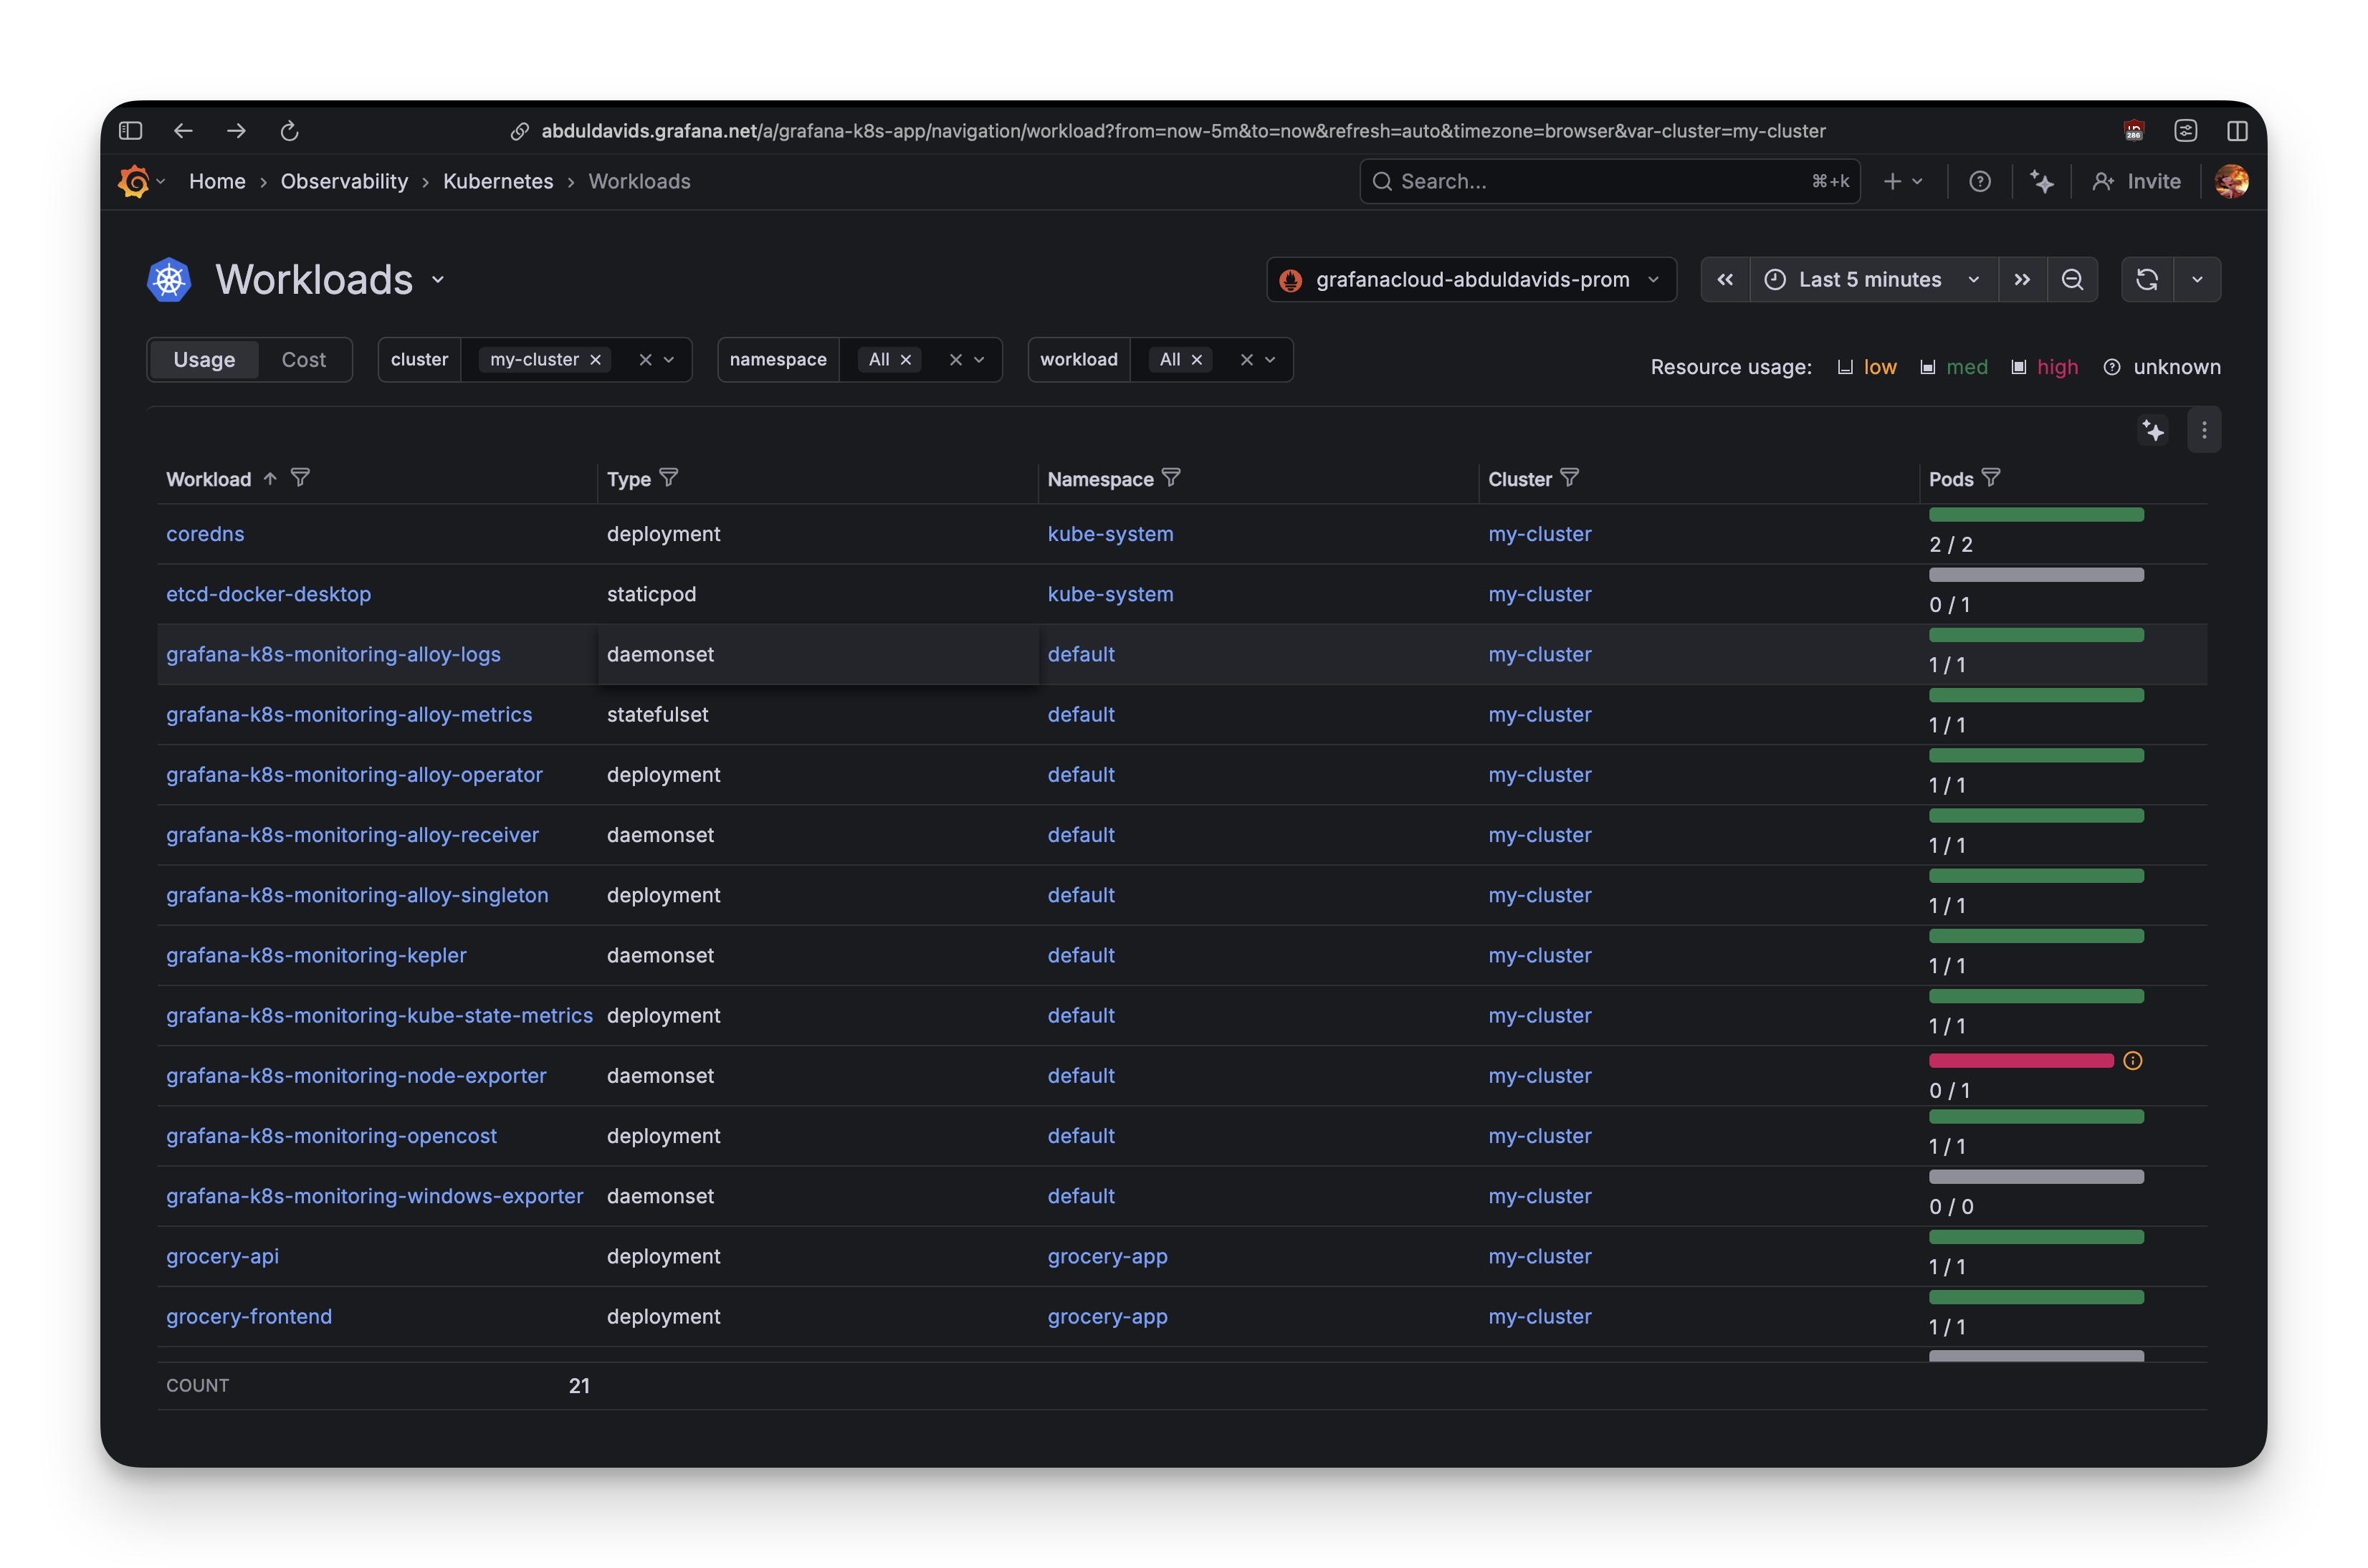
But here's the catch: you need to know what query to write.
Want to see CPU usage as a rate? Write rate(container_cpu_usage_seconds_total{namespace="grocery-app"}[5m]). What's a rate function? What's [5m]? Why does order matter? The Explore page has a metrics browser, but you still need to understand which of the 5,000 available metrics matter.
This is Grafana's trade-off: maximum flexibility requires maximum knowledge.
Developer Experience
Now, let's talk about developer experience.
Setup Complexity
- SigNoz: Single shell script installation (./install.sh) with Docker Compose. Batteries-included approach, ideal for beginners.
- DataDog: Account creation required (but no payment details for free tier). Agent installation involves Kubernetes Operators and custom resources, adding friction for beginners.
- Grafana Cloud: Helm chart installs 8 components (Alloy Operator, kube-state-metrics, etc.), making the architecture complex for beginners to troubleshoot.
Query Language Barrier
- SigNoz: UI-driven query builder with dropdowns, beginner-friendly. Less powerful than PromQL but more accessible.
- DataDog: Mostly UI-driven with tag filtering. Visual editor for custom dashboards. Helps beginners avoid complex query languages.
- Grafana Cloud: PromQL is unavoidable for custom metrics and advanced dashboards. LogQL is simpler for logs. Requires learning a query language for full power.
Documentation Quality
- SigNoz: Clear, focused getting-started guides. Could improve on explaining configuration choices (minimal vs. production setup).
- DataDog: Comprehensive but scattered across multiple guides. Examples are plentiful, but community support is often needed for troubleshooting.
- Grafana Cloud: Split between integration guides and dense Helm chart documentation. Assumes knowledge of OpenTelemetry and Kubernetes service discovery. Large community helps fill documentation gaps.
Cost Transparency
| Open Source | Free (self-hosted) | - | Free (self-hosted) |
| Pricing Model | Usage-based (Cloud): $0.1/M metrics, $0.3/GB logs, $0.3/M spans | Confusing, host-based: $15/host/month (infra), $31/host/month (APM), usage-based for logs/custom metrics | Usage-based (beyond free tier): $8/10K active series, $0.50/GB logs, $0.50/GB traces |
| Free Tier | Open-source version is free (self-hosted) | 5 hosts, 1M log events (limited retention) | 10K metrics, 50GB logs, 50GB traces per month |
| Estimated Cost (Example App) | ~$220/month (Cloud) / Depends on infrastructure (self-hosted) | ~$320+/month (minimum, can triple) | ~$50-60/month (beyond free tier) |
So Which One Do You Actually Use?
After setting up all three, here's what we learned:
SigNoz is what you use when you just want it to work. Three minutes from ./install.sh to seeing application traces. No account signup, no API keys, no choosing between seventeen configuration options. Add another 10 minutes to configure the OpenTelemetry collector for Kubernetes, and you get full infrastructure monitoring correlated with your application traces in one dashboard.
DataDog is what enterprises pay for. The cluster map is impressive?you can watch pods scale as hexagons that pop in. The Orchestrator Explorer gives you complete visibility into every Kubernetes object. Event correlation makes troubleshooting easier.
But you pay for it: 20-35 minutes of setup, debugging Kubernetes Operators, fixing admission controller errors, and navigating a UI that wants to sell you seventeen products. The free tier (5 hosts, 1M log events) lets you learn without a credit card. But once you exceed those limits, you're looking at $300+/month minimum.
If you're at a company with budget and dedicated DevOps engineers, DataDog works. If you're a solo developer or bootstrapped startup, the complexity and cost will be challenging.
Grafana is what you use when you want maximum control and you're willing to learn. Infrastructure metrics flow immediately?cluster CPU, memory, pod logs, and Kubernetes events all work out of the box. The free tier is generous (10k metrics, 50GB logs, 50GB traces).
The Bottom Line
All three platforms work well once configured. The grocery app scaled from 1 pod to 5 on all of them. Metrics flowed, dashboards updated, pod failures were visible. They all succeed at monitoring Kubernetes.
The difference is how much effort it takes to get there.
SigNoz gets out of your way?three minutes and you're monitoring. DataDog makes you fight Kubernetes Operators and admission controllers for 25 minutes. Grafana gives you all the data but requires learning a query language to use it effectively.
Try It Yourself
You can try the demo app from the grocery-sharing-app repository. The repository has branches with the setup for each service:
- signoz
- datadog
- grafana
The deployment script is ready to run:
This creates the grocery-app namespace, deploys PostgreSQL, API, frontend, and load generators, and sets up autoscaling. Within 60 seconds you'll see pods scaling under load. Install SigNoz, DataDog, or Grafana and compare your experience. The full guide at demo-app/GUIDE.md walks through setup, load generation, and evaluation criteria for each platform.


