.png)

Introduction
Converging evidence from the study of model organisms and human brain tissue suggests that epigenetic aging—a metric of biological age based on DNA methylation patterns—plays a critical role in Alzheimer’s disease (AD) pathophysiology. Briefly defined, epigenetics and epigenetic aging are measurable changes to DNA (often via DNA methylation) that occur over the lifespan and are regulated by genetic variation, behavior, environment, and human disease. Transgenic mouse models of AD demonstrate unique epigenetic alterations associated with AD pathology1,2, and studies of human brain tissue show marked DNA methylation differences in AD when compared to normal aging brain3,4. By contrast, data from clinical studies has been mixed. For example, a recent systematic review largely using cross-sectional studies found no strong evidence that epigenetic age estimates were associated with risk for dementia or mild cognitive impairment (MCI),5 while other smaller studies have suggested a limited though promising relationship with risk for AD or related disease biomarkers4,6.
There are multiple possible explanations for these surprisingly discrepant findings as insights from mouse models and post-mortem human tissue are translated into clinical settings. First, most clinical studies performed to date have been cross-sectional rather than longitudinal—limiting evaluation for disease risk-modifying effects which may not appear on same-visit cognitive scores or biomarker measurements. Second, multiple generations of epigenetic clocks have been developed for analysis, with each generation and associated score based on distinct analytic underpinnings and resulting in distinct interpretations—making comparison and replication of results challenging. Finally, many studies have focused on one or two related outcomes, such as disease status and cognitive scores, which may not be sensitive to interindividual differences in disease trajectory. Taken together, these findings suggest the need for additional studies using more sensitive longitudinal and biomarker data paired with well-established and validated epigenetic clocks.
Therefore, we investigated the relationship between two well-validated second-generation epigenetic clocks, DNAmPhenoAge and DNAmGrimAge7,8,9, and the risk for MCI or AD using longitudinal analyses and multimodal neuroimaging. Specifically, we analyzed the rate of progression from cognitively normal (CN) aging to either MCI or AD, longitudinal cognitive changes, and cortical thinning and white matter hyperintensities (WMH) on magnetic resonance imaging (MRI). We hypothesized that combined longitudinal and multimodal imaging analyses would increase our ability to detect the modulation of AD risk by epigenetic age and that epigenetic age would predict AD risk independent of chronologic age.
Results
Cohort
Data from 403 participants from the Alzheimer’s Disease Neuroimaging Initiative (ADNI) diagnosed as CN, MCI, or AD with DNA methylation data, as well as quantitative neuroimaging data, were included in this study (Table 1). The cohort was balanced with respect to sex and education (both p > 0.05) with expected differences in APOE ε4 dosage, Clinical Dementia Rating Scale Sum of Boxes (CDR-SB), Mini Mental State Exam (MMSE), and Montreal Cognitive Assessment (MoCA) scores (all p < 0.001). Interestingly, there was a significant difference (p = 0.01) in chronologic age, with the MCI group slightly younger (mean 72.8 years) than the CN (mean 75.3 years) and AD (mean 74.6) cohorts. As demonstrated in prior analyses of ADNI data, there were no significant differences between epigenetic age across groups for both DNAmPhenoAge (p = 0.69) or DNAmGrimAge (p = 0.13)4. In the longitudinal datasets in CN and MCI participants, the number of follow-up visits was similar (p = 0.10), but the length of follow-up was longer in CN compared to MCI (p < 0.001). A subset of study participants had processed Freesurfer data available for analysis (n = 335) and was overall similar in composition when compared to the parent cohort shown in Table 1.
DNAmGrimAge and DNAmPhenoAge correlations with chronologic age
Data used in these analyses included all 403 patients described in Table 1. Using the Pearson technique, we found that epigenetic age correlated with chronologic age, but was not an exact proxy for chronologic age. The correlation coefficient for DNAmPhenoAge was 0.74 (95% confidence interval (CI) 0.70-0.78, p < 2.2 × 10⁻¹⁶), slightly lower than the correlation coefficient observed for DNAmGrimAge at 0.87 (95% CI 0.85-0.89, p < 2.2 × 10⁻¹⁶).
DNAmGrimAge and DNAmPhenoAge predict progression to MCI and AD
Analyses in this section utilized longitudinal clinical follow-up data from participants diagnosed as CN (n = 121), with progression defined as a change in clinical diagnosis from CN to MCI or CN to AD. Participants progressed to MCI or AD in 24.0% (n = 29) of the group over the study period (Table 1). Using Cox proportional hazard modeling, we found that DNAmPhenoAge (hazard ratio (HR) 1.06; 95% confidence intervals [CI] 1.02–1.10; p = 3.45 × 10⁻³) associated with conversion to MCI or AD (Fig. 1). There was also a trend towards significance for DNAmGrimAge (HR 1.03; 95% CI 1.00–1.06; p = 0.06) (Fig. 1). As a sensitivity analysis, we tested whether the effect of epigenetic age persisted after covarying for chronologic age (i.e., epigenetic age acceleration) and found that DNAmPhenoAge still significantly predicted progression in CN participants (HR 1.07; 95% CI 1.01–1.13; p = 0.03).
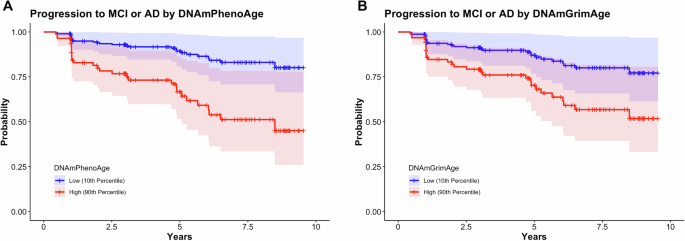
Survival plots stratified by epigenetic age (high = 90th percentile; low = 10th percentile) in participants who were cognitively normal at baseline are shown. DNAmPhenoAge was significantly associated with progression to MCI or AD (A; p = 0.006) and there was a trend towards significance for DNAmGrimAge (B; p = 0.06). Of note, DNAmPhenoAge significantly associated with progression to MCI or AD even after covarying for chronologic age (p = 0.03). Shading represents 95% confidence intervals. Survival analyses were conducted using Cox proportional hazards modeling covarying for sex, education, CDR-SB score, and APOE ε4 dose; post hoc sensitivity analyses additionally covaried for chronologic age.
DNAmPhenoAge predicts longitudinal cognitive changes during normal aging
Given the findings above highlighting the importance of epigenetic age acceleration as a predictor of progression from CN to MCI or AD, we next asked whether accelerated epigenetic age was also associated with longitudinal cognitive changes during normal aging and early neurodegenerative disease. To address this, we examined a combined cohort composed of the CN participants described in the above survival analyses and study participants diagnosed with MCI.
Analyzing longitudinal CDR-SB, MoCA, and MMSE scores in the combined CN and MCI cohort, we found that accelerated epigenetic age, as measured by DNAmPhenoAge, was associated with worsened clinical and cognitive outcomes. Even after controlling for the effects of chronologic age, DNAmPhenoAge was associated with worsened clinical outcomes as evidenced by increasing CDR-SB (Fig. 2A; β ± standard error (SE) = 8.41 × 10⁻³ ± 2.72 × 10⁻³; p = 1.95 × 10⁻³), decreasing MoCA (Fig. 2B; β ± SE = -0.01 ± 4.64 × 10⁻³; p = 5.01 × 10⁻³), and decreasing MMSE scores (Fig. 2C; β ± SE = -0.02 ± 4.36 × 10⁻³; p = 9.25 × 10⁻⁶) over time. Findings for DNAmGrimAge were attenuated when compared to DNAmPhenoAge, with no findings remaining significant after accounting for chronologic age. Full results for both DNAmPhenoAge and DNAmGrimAge are shown in Table S1.
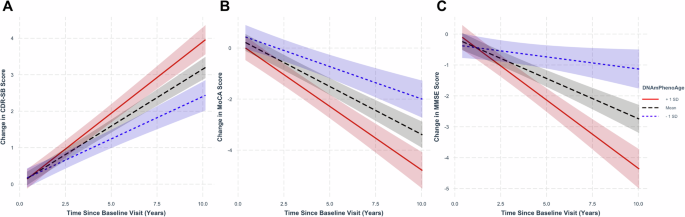
Regression plots in normal controls and mild cognitive impairment stratified by epigenetic age at representative levels (−1 standard deviation [SD] corresponding to the ~16th percentile; +1 SD corresponding to the ~84th percentile; and mean for reference). Advanced epigenetic age as measured by DNAmPhenoAge associated with worsened clinical scores as measured by CDR-SB (A; p = 0.002), MoCA (B; p = 5.01 × 10⁻³), and MMSE (C; p = 9.25 × 10⁻⁶). Shading indicates 95% confidence intervals. Linear mixed-effects analyses were performed covarying for chronologic age, sex, education, baseline score, and APOE ε4 dose.
Epigenetic age associated with neuroimaging markers of AD across the spectrum of normal aging to AD
Given the associations between measures of increased epigenetic age and progression to MCI or AD, we next evaluated their association with neuroimaging biomarkers of AD, including whole-brain cortical thickness and WMH volumes. Due to differences in processing technique and data availability, only a subset of participants had cortical thickness measurements available (n = 335; see Table S2 for additional details). All participants in the survival analyses described above had WMH quantifications available for analysis.
Across the spectrum of normal aging to AD, accelerated epigenetic age was associated with cortical thinning in nearly every brain region for 60 of 68 ROIs for DNAmPhenoAge and 59 of 68 cortical ROIs for DNAmGrimAge (pFalse Discovery Rate (FDR) < 0.05; Tables S3 and S4; Fig. 3). Interestingly, the strongest associations were predominantly located in the temporal and parietal lobes in regions relevant to AD, such as entorhinal cortex and fusiform gyrus (Fig. 3).
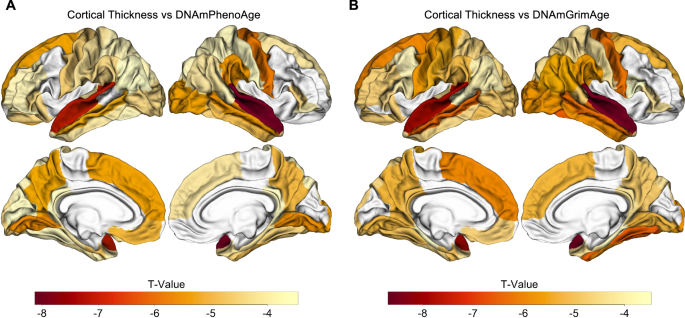
Epigenetic age associated with cortical atrophy across the spectrum of normal aging to AD. Both DNAmPhenoAge (A) and DNAmGrimAge (B) are associated with cortical atrophy in AD-relevant regions such as entorhinal cortex, parahippocampal gyrus, and precuneus (all significant at a FDR-corrected threshold of pFDR < 0.05). Images were processed using Freesurfer 5.1, and regions of interest were extracted from the Desikan-Killiany atlas. The relationship between cortical thickness and DNA methylation age was assessed using multiple regression covarying for sex, education, CDR-SB score, APOE ε4 dose, and total intracranial volume.
To better understand the factors driving these findings, we conducted exploratory analyses examining DNAmPhenoAge and DNAmGrimAge within each diagnostic group and found these associations between accelerated epigenetic age and cortical atrophy were driven largely by the CN and MCI groups. For example, in the CN cohort, there were associations for 42 and 47 of 68 cortical ROIs for DNAmPhenoAge and DNAmGrimAge, respectively (pFDR < 0.05; Table S5, Fig. 4A, B). Similar findings were observed in the MCI group with associations for 48 and 42 of 68 cortical ROIs for DNAmPhenoAge and DNAmGrimAge, respectively (pFDR < 0.05; Table S5, Fig. 4C, D). In contrast, the AD cohort showed no significant associations after correction for multiple testing.
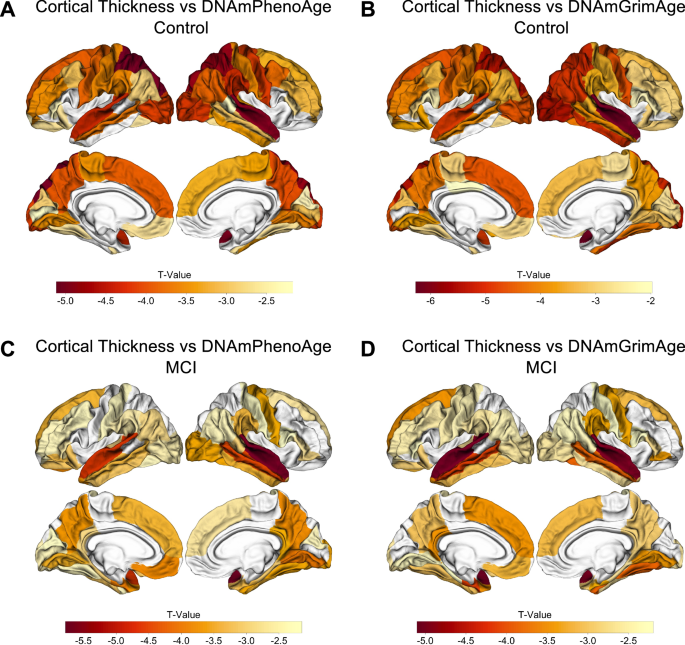
Epigenetic age associated with cortical atrophy in both normal cognition and MCI. In controls, both DNAmPhenoAge and DNAmGrimAge were associated with cortical atrophy in AD-relevant regions for 42 and 47 of 68 cortical ROIs at an FDR-corrected threshold of pFDR < 0.05, respectively (A, B). For MCI, 48 of 68 cortical ROIs were significant at a pFDR < 0.05 for DNAmPhenoAge (C), and 42 of 68 cortical ROIs were significant at a pFDR < 0.05 for DNAmGrimAge (D). The relationship between cortical thickness and DNA methylation age was assessed using multiple regression covarying for sex, education, CDR-SB score, APOE ε4 dose, and total intracranial volume.
As a sensitivity analysis, we next repeated the above analyses while adding chronological age to the multiple regression model to better understand whether accelerated epigenetic age provided additional disease-relevant signals beyond that explained by advancing chronological age. In the CN subgroup, the association between epigenetic age and cortical thinning was mildly attenuated, though it remained significant at a pFDR < 0.05 value for 13 of 68 ROIs for DNAmPhenoAge and 39 of 68 ROIs for DNAmGrimAge. Of note, many of the regions that remained significant after covarying for chronological age are those relevant to AD progression, including the precuneus, cuneus, and fusiform gyrus.
Transitioning our analyses to examine WMH, we found that DNAmPhenoAge and DNAmGrimAge were both strongly associated with WMH volumes in the combined cohort (praw < 0.001, Table 2) and when each diagnostic subgroup was considered individually (all praw < 0.05; Table 2). The associations between epigenetic age and WMH volumes were strongest in patients diagnosed with AD, where DNAmPhenoAge and DNAmGrimAge were associated with WMH volume after covarying for chronologic age (praw < 0.05; Table 2).
Discussion
Among CN individuals, we found that accelerated epigenetic age associated with progression to either MCI or AD and with cognitive decline independent of chronological age. Furthermore, accelerated epigenetic age based on DNAmPhenoAge and DNAmGrimAge associated with cortical thinning in AD-relevant regions and WMH burden across the spectrum of normal aging to neurodegenerative disease. Interestingly, the relationship between epigenetic age and cortical thinning in AD-implicated regions appeared most robust in CN participants, while the association between epigenetic age and WMH was greatest in participants with AD. Considered together, our findings suggest that advanced epigenetic age modulates risk for AD and cognitive decline even during their most nascent stages.
Our findings suggest that epigenetic age—as measured from peripheral blood—plays an important role in AD risk above and beyond that explained by chronological age, especially in CN individuals. These findings suggest that while epigenetic age and chronological age are highly correlated, each provides unique, disease-relevant information. Building on prior literature10,11,12, these findings lend support to the hypothesis that the processes underlying biological aging, which are only partially accounted for by chronologic age, contribute significantly to the development and progression of AD. Further, our data indicates that epigenetic age is more sensitive than chronological age in proxying this underlying biology. Indeed, even after covarying for chronologic age, elevated DNAmPhenoAge remained significantly associated with clinical progression, worsened MoCA scores, and cortical thinning. Given this, epigenetic age biomarkers may play a key role in identifying patients at risk for AD (and other diseases of aging) prior to symptom onset. For example, while amyloid can be detected up to 15 years prior to clinical symptoms13 it can be challenging to measure due to cost (e.g., PET scan14) or invasiveness (e.g., lumbar puncture15). In future clinical practice, estimates of epigenetic age may provide simple and minimally invasive metrics of AD risk that may also be relevant to other age-related conditions and diseases. It remains to be determined whether epigenetic age would provide similar or additional information beyond what is provided by other emerging tests for AD risk, such as those measuring p-tau-21716.
Building on prior work, our results suggest that employing a combination of analytic strategies, including longitudinal cognitive analyses and the use of neuroimaging biomarkers of disease, may be useful for the validation of current and future epigenetic clocks. Of the prior studies showing a positive effect, one of the most conclusive also employed a survival analysis framework, though there was no significant association for DNAmPhenoAge4. While this study used cognitive and diagnostic data from the ADNI cohort, the authors did not perform survival analyses using ADNI data, nor did the study involve analysis of neuroimaging data. In addition, this study did not formally test whether epigenetic age was associated with longitudinal cognitive changes. Other promising studies examining epigenetics that have shown an association between disease progression and neuroimaging biomarkers have focused on MCI rather than CN17 or have focused on overall mortality rather than AD18. Our findings suggest that an analytic framework, rather than a lack of a biologic relationship, may explain the seeming paucity of evidence linking findings from model organisms and human brain tissue to clinical populations.
We observed stronger associations between DNAmPhenoAge and disease progression, whereas DNAmGrimAge was associated more strongly with some neuroimaging biomarkers. While speculative, we hypothesize that these differences are due to differential capture of AD-related risk factors by each epigenetic clock. For example, DNAmGrimAge differs from DNAmPhenoAge, a general lifespan clock, in that it was partially trained on serum proteins that predict mortality and smoking history19. As such, DNAmGrimAge is strongly associated with time to death, time to coronary heart disease, time to cancer, and multiple other mortality-associated (rather than age-related) outcomes19, which may not be captured by DNAmPhenoAge but could be reflected by changes in a brain MRI, including cortical thinning. Evaluating the relative strengths and weaknesses of each generation of epigenetic clocks and their subscores is beyond the scope of this article but may be a fruitful area for future research.
Comparing our neuroimaging analyses, we observed that epigenetic age was associated most strongly with cortical thickness in CN and MCI whereas relationships with WMH were most pronounced in AD. The etiology behind these findings is unclear but likely multifactorial. For example, while WMH is classically attributed to metabolic comorbidities—such as diabetes mellitus or hypertension—frequently observed in AD patients, emerging literature suggests that AD diagnosis contributes to WMH independent of these established risk factors20. Second, AD patients have substantially more WMH when compared to CN and MCI, potentially increasing statistical power to detect an effect. Future studies will be required to further delineate and test these hypotheses.
Our study benefits from its use of a thoroughly characterized cohort spanning the spectrum of normal aging to AD, as well as our use of multiple strategies to test whether epigenetic age associated with AD risk. Limitations of our study include the use of only two second-generation epigenetic clocks and the lack of a suitable replication cohort, given our multimodal approach. Our reliance on peripheral blood methylation data is both a strength, given its ease of acquisition, and a limitation, given it does not directly measure methylation in the brain. However, data from multiple studies has shown that peripheral blood methylation changes are a reasonable proxy for the brain with r > 0.8521,22 and may also provide additional AD-relevant data about immune function as well as cardiovascular and metabolic disease. Future studies will be required to determine whether epigenetic age predicts longitudinal cortical atrophy.
In summary, we found that epigenetic age associated with progression to MCI or AD and cognitive decline in CN individuals as well as cortical thinning in AD-relevant regions and increased WMH across the spectrum of normal aging to neurodegenerative disease. Our analytic framework was critical to the successful identification of these associations, and using a similar technique with other epigenetic clocks and neurodegenerative as well as other age-related diseases may be useful in future work. More generally, this study underscores the importance of advanced biologic age—above and beyond chronologic age—as a risk factor for AD and as a potential biomarker for clinical use.
Methods
Participant characteristics
This study utilized samples from 403 participants from ADNI with DNA methylation and structural neuroimaging data available. At baseline, 121 participants were considered CN, 236 were diagnosed with MCI, and 46 were diagnosed with AD. ADNI is a longitudinal study of subjects across the US that includes multimodal neuroimaging, blood biomarkers, and clinical markers of AD and has been described previously23,24. All baseline methylation and neuroimaging data were acquired as part of the ADNI2/GO phase of the study. As part of the study, patients undergo a rigorous clinical exam, which includes neurologic examination, neuropsychiatric evaluation, cognitive testing, blood sampling, and brain MRI25. Participants were diagnosed as CN or with MCI or AD based on a structured protocol that integrated clinical data, cognitive testing, and brain MRI results, which have been described previously26. Clinical characteristics are detailed in Table 1. Clinical symptom severity was measured using the CDR-SB score27. Cognitive changes over time were measured using the MMSE28 and MoCA29. Written and informed consent was obtained from study participants in compliance with local and ADNI protocols as has been previously described30. This study was approved by the University of California, San Francisco Institutional Review Board (IRB #17-21518).
Image acquisition and processing
All images were acquired on 3 Tesla scanners according to previously described ADNI2/GO protocols at the participants’ baseline visit31,32. Structural MRI images from all participants were segmented using data from two pipelines provided by the ADNI MRI core to evaluate cortical structure and white matter disease. Cortical segmentation and structural analysis were performed using FreeSurfer version 5.1 using T1-weighted images as previously described33,34. Briefly, all images were segmented using FreeSurfer’s automated pipeline and then manually checked for segmentation accuracy, with segmentation errors manually corrected by the ADNI MRI core team35. Cortical thickness measurements from 68 cortical regions of interest (ROI; 34 for each hemisphere) in the Desikan-Killiany atlas34 were retained for analysis. White matter disease was estimated using a pipeline developed at the University of California, Davis, which quantifies WMH volumes via Bayesian modeling based on participants’ 3D T1 and FLAIR images36. All clinical data, preprocessed imaging data, and genetic data were downloaded from the Laboratory of Neuro Imaging (LONI) Imaging and Data Archive (IDA) at www.ida.loni.usc.edu.
DNA methylation assessment
DNA methylation was profiled from blood samples of ADNI participants using the Illumina Infinium Human Methylation EPIC V1 BeadChip Array, which covers ~866,000 CpGs (illumina.com). Briefly, to pre-process the DNA methylation data, we used the minfi pipeline, and low-quality samples were identified using the qcfilter() function from the ENmix package, using default parameters37,38. Quality control procedures were performed, including removal of samples with abnormal CpG detection p-values > 0.05, checking the ratio of X/Y chromosome probe intensities for sex concordance, and comparison of targeted SNP genotypes to genotype microarray data as previously described39. Epigenetic clocks were calculated according to published methods from processed DNA methylation data. Estimates of epigenetic age for the Levine 513 CpG site DNAmPhenoAge clock8 and DNA methylation-based mortality risk assessment (DNAmGrimAge)7 were calculated using R scripts. Mean imputation was utilized for missing values. The first time point for each peripheral blood sample was used for epigenetic age estimation. For a subset of patients, technical replicates were present, and in these situations, we averaged the mean epigenetic age across replicates for all downstream analyses.
Statistical analysis
All statistical analyses were completed using R 4.1.240.
We assessed the correlation between epigenetic age and chronologic age using the Pearson method.
As has been done in prior work19 and in line with our hypotheses, we first performed all analyses using epigenetic age alone to predict disease progression and neuroimaging biomarkers. For outcomes that demonstrated a significant relationship at p < 0.05, we specifically tested whether epigenetic age provided independent information above and beyond chronologic age by covarying for chronologic age in addition to all previously listed covariates. This technique has the added benefit of also testing for epigenetic age acceleration—defined in cross-sectional datasets as having an advanced epigenetic age relative to chronologic age.
Longitudinal analyses of the effect of epigenetic age on disease progression were performed using Cox proportional hazard modeling with the R package ‘survival’41, controlling for APOE ε4 allele dosage, sex, years of education, and CDR-SB. Conversion to disease was analyzed in CN participants and was defined as a change in clinical diagnosis from CN to MCI or CN to AD. The proportional hazards assumption was tested for each model using the ‘cox.zph’ function and were not statistically significant (p > 0.05 level for all analyses shown). For illustrative purposes, projected survival curves were plotted for patients at the 10th and 90th percentiles of epigenetic age for the control cohort.
Mixed-effects linear regression analyses were used to assess the relationship between baseline epigenetic age and longitudinal CDR-SB, MMSE, and MoCA scores in study participants diagnosed as CN or MCI, controlling for baseline and time interactions of baseline score, sex, years of education, and APOE ε4 dosage. We used the following linear mixed-effect model:
\(\Delta {\rm{Score}}={\beta }_{0}+{\beta }_{1}\Delta t+{\beta }_{2}{{\rm{Score}}}_{{\rm{baseline}}}* \Delta t+{\beta }_{3}{\rm{Sex}}* \Delta t+{\beta }_{4}{\rm{Education}}* \Delta t+{\beta }_{5}{APOE}\varepsilon 4* \Delta {\rm{t}}+{\rm{\beta }}6{\rm{EpigeneticAge}}* \Delta {\rm{t}}+{\rm{e}}(1{\rm{|Subject}})\)
Associations between epigenetic age and cortical thickness based on the study participants’ baseline MRI were analyzed using multiple regression after covarying for APOE ε4 dosage, sex, years of education, CDR-SB, and total intracranial volume. We first analyzed the combined cohort of all participants from across the spectrum of CN to AD, using the CDR-SB score to account for clinical severity. Following this, we analyzed each diagnostic grouping independently to assess for effects in each unique clinical grouping. Volume-rendered images of multiple regression analysis results were created using the R package ‘fsbrain’42.
Where applicable, correction for multiple comparisons was completed using the FDR technique43.
Data availability
Data from ADNI is available after application through a publicly accessible research portal (ADNI: adni.loni.usc.edu/data-samples/access-data/). Data used in preparation of this article were obtained from the Alzheimer’s Disease Neuroimaging Initiative (ADNI) database (adni.loni.usc.edu). As such, the investigators within the ADNI contributed to the design and implementation of ADNI and/or provided data but did not participate in the analysis or writing of this report.
Code availability
Not applicable.
References
Sanchez-Mut, J. V. et al. DNA methylation map of mouse and human brain identifies target genes in Alzheimer’s disease. Brain 136, 3018–3027 (2013).
Griñán-Ferré, C. et al. Understanding epigenetics in the neurodegeneration of Alzheimer’s disease: SAMP8 mouse model. J. Alzheimer’s Dis. 62, 943–963 (2018).
Lang, A.-L. et al. Methylation differences in Alzheimer’s disease neuropathologic change in the aged human brain. Acta Neuropathol. Commun. 10, 174 (2022).
Sugden, K. et al. Association of pace of aging measured by blood-based DNA methylation with age-related cognitive impairment and dementia. Neurology 99, e1402–e1413 (2022).
Zhou, A. et al. Epigenetic aging as a biomarker of dementia and related outcomes: a systematic review. Epigenomics 14, 1125–1138 (2022).
Milicic, L. et al. Comprehensive analysis of epigenetic clocks reveals associations between disproportionate biological ageing and hippocampal volume. GeroScience 44, 1807–1823 (2022).
Lu, A. T. et al. DNA methylation GrimAge version 2. Aging 14, 9484–9549 (2022).
Levine, M. E. et al. An epigenetic biomarker of aging for lifespan and healthspan. Aging 10, 573–591 (2018).
Margiotti, K., Monaco, F., Fabiani, M., Mesoraca, A. & Giorlandino, C. Epigenetic clocks: in aging-related and complex diseases. Cytogenet. Genome Res. 163, 247–256 (2023).
Hamczyk, M. R., Nevado, R. M., Barettino, A., Fuster, V. & Andrés, V. Biological versus chronological aging: JACC focus seminar. J. Am. Coll. Cardiol. 75, 919–930 (2020).
Ho, K. M., Morgan, D. J., Johnstone, M. & Edibam, C. Biological age is superior to chronological age in predicting hospital mortality of the critically ill. Intern Emerg. Med. 18, 2019–2028 (2023).
Li, A., Koch, Z. & Ideker, T. Epigenetic aging: Biological age prediction and informing a mechanistic theory of aging. J. Intern. Med. 292, 733–744 (2022).
Jack, C. R. et al. NIA-AA research framework: toward a biological definition of Alzheimer’s disease. Alzheimers Dement. 14, 535–562 (2018).
Witte, M. M. et al. Clinical use of amyloid-positron emission tomography neuroimaging: practical and bioethical considerations. Alzheimers Dement. 1, 358–367 (2015).
Peskind, E. R. et al. Safety and acceptability of the research lumbar puncture. Alzheimer Dis. Assoc. Disord. 19, 220 (2005).
Ashton, N. J. et al. Diagnostic accuracy of a plasma phosphorylated Tau 217 immunoassay for Alzheimer disease pathology. JAMA Neurol. 81, 255–263 (2024).
Liu, H., Lutz, M. & Luo, S. & Alzheimer’s Disease Neuroimaging Initiative Genetic association between epigenetic aging-acceleration and the progression of mild cognitive impairment to Alzheimer’s disease. J. Gerontology Ser. A 77, 1734–1742 (2022).
Hillary, R. F. et al. An epigenetic predictor of death captures multi-modal measures of brain health. Mol. Psychiatry 26, 3806–3816 (2021).
Lu, A. T. et al. DNA methylation GrimAge strongly predicts lifespan and healthspan. Aging 11, 303–327 (2019).
Garnier-Crussard, A., Cotton, F., Krolak-Salmon, P. & Chételat, G. White matter hyperintensities in Alzheimer’s disease: Beyond vascular contribution. Alzheimer’s. Dement. 19, 3738–3748 (2023).
Nishitani, S. et al. Cross-tissue correlations of genome-wide DNA methylation in Japanese live human brain and blood, saliva, and buccal epithelial tissues. Transl. Psychiatry 13, 72 (2023).
Braun, P. R. et al. Genome-wide DNA methylation comparison between live human brain and peripheral tissues within individuals. Transl. Psychiatry 9, 1–10 (2019).
Petersen, R. C. et al. Alzheimer’s Disease Neuroimaging Initiative (ADNI): clinical characterization. Neurology 74, 201–209 (2009).
Veitch, D. P. et al. The Alzheimer’s Disease Neuroimaging Initiative in the era of Alzheimer’s disease treatment: a review of ADNI studies from 2021 to 2022. Alzheimers Dement. https://doi.org/10.1002/alz.13449 (2023).
ADNI General Procedures Manual. ADNI. https://adni.loni.usc.edu/wp-content/uploads/2010/09/ADNI_GeneralProceduresManual.pdf. (2010).
Bonham, L. W. et al. Insulin-like growth factor binding protein 2 is associated with biomarkers of Alzheimer’s disease pathology and shows differential expression in transgenic mice. Front. Neurosci. 12, 476 (2018).
Morris, J. C. The Clinical Dementia Rating (CDR): current version and scoring rules. Neurology 43, 2412–2414 (1993).
Folstein, M. F., Folstein, S. E. & McHugh, P. R. ‘Mini-mental state’. A practical method for grading the cognitive state of patients for the clinician. J. Psychiatr. Res. 12, 189–198 (1975).
Nasreddine, Z. S. et al. The Montreal Cognitive Assessment, MoCA: a brief screening tool for mild cognitive impairment. J. Am. Geriatr. Soc. 53, 695–699 (2005).
Petersen, R. C. et al. Alzheimer’s Disease Neuroimaging Initiative (ADNI). Neurology 74, 201–209 (2010).
Jack, C. R. Jr et al. Overview of ADNI MRI. Alzheimer’s. Dement. 20, 7350–7360 (2024).
Alzheimer’s Disease Neuroimaging Initiative. ADNI https://adni.loni.usc.edu/data-samples/adni-data/neuroimaging/mri/mri-scanner-protocols/. (2025).
Fischl, B. FreeSurfer Neuroimage 62, 774–781 (2012).
Desikan, R. S. et al. An automated labeling system for subdividing the human cerebral cortex on MRI scans into gyral based regions of interest. Neuroimage 31, 968–980 (2006).
Hartig, M. et al. ADNI FreeSurfer Methods and QC. ADNI https://adni.bitbucket.io/reference/docs/UCSFFSX51/UCSF%20FreeSurfer%20Methods%20and%20QC_OFFICIAL.pdf. (2014).
DeCarli, C., Maillard, P. & Fletcher, E. Four Tissue Segmentation in ADNI II. ADNI https://files.alz.washington.edu/documentation/adniproto.pdf. (2013).
Aryee, M. J. et al. Minfi: a flexible and comprehensive Bioconductor package for the analysis of Infinium DNA methylation microarrays. Bioinformatics 30, 1363–1369 (2014).
Xu, Z., Niu, L., Li, L. & Taylor, J. A. ENmix: a novel background correction method for Illumina HumanMethylation450 BeadChip. Nucleic Acids Res. 44, e20 (2016).
Davis, J. W. et al. Microarray Whole-genome Dna Methylation Profiling of ADNI Participants. ADNI. (2017).
R Core Team (2024). R: A Language and Environment for Statistical Computing. R Foundation for Statistical Computing, Vienna, Austria.
Terry M. Therneau, Patricia M. Grambsch (2000). Modeling Survival Data: Extending the Cox Model. Springer, New York.
Schäfer, T. & Ecker, C. fsbrain: an R package for the visualization of structural neuroimaging data. Preprint at https://doi.org/10.1101/2020.09.18.302935 (2020).
Benjamini, Y. & Hochberg, Y. Controlling the false discovery rate: a practical and powerful approach to multiple testing. J. R. Stat. Soc. Ser. B 57, 289–300 (1995).
Acknowledgements
Author funding: J.S.Y. receives funding from NIH-NIA R01AG062588, R01AG057234, P30AG062422, P01AG019724, and U19AG079774; NIH-NINDS U54NS123985; NIH-NIDA 75N95022C00031; the Rainwater Charitable Foundation; the Bluefield Project to Cure Frontotemporal Dementia; the Alzheimer’s Association; the Global Brain Health Institute; the French Foundation; and the Mary Oakley Foundation. J.S.Y. serves on the scientific advisory board for the Epstein Family Alzheimer’s Research Collaboration. L.W.B receives funding from NIH-NIBIB T32EB001631 and RSNA R&E Foundation RR24‐217. A.I. is supported by grants from ReDLat (National Institutes of Health and the Fogarty International Center (FIC)), National Institute on Aging R01AG057234, R01AG075775, R01AG021051, R01AG083799, Alzheimer's Association SG-20-725707, the Rainwater Charitable Foundation, the Bluefield Project to Cure FTD, and the Global Brain Health Institute, ANID/FONDECYT Regular (1210195, 1210176, and 1220995); and ANID/FONDAP/15150012. The content of this publication is solely the responsibility of the authors and does not necessarily represent the official views of the NIH, RSNA R&E Foundation, or other funding institutions. ADNI funding: Data collection and sharing for this project was funded by the Alzheimer's Disease Neuroimaging Initiative (ADNI) (National Institutes of Health Grant U01 AG024904). ADNI is funded by the National Institute on Aging, the National Institute of Biomedical Imaging and Bioengineering, and through generous contributions from the following: AbbVie, Alzheimer’s Association; Alzheimer’s Drug Discovery Foundation; Araclon Biotech; BioClinica, Inc.; Biogen; Bristol-Myers Squibb Company; CereSpir, Inc.; Cogstate; Eisai Inc.; Elan Pharmaceuticals, Inc.; Eli Lilly and Company; EuroImmun; F. Hoffmann-La Roche Ltd and its affiliated company Genentech, Inc.; Fujirebio; GE Healthcare; IXICO Ltd.; Janssen Alzheimer Immunotherapy Research & Development, LLC.; Johnson & Johnson Pharmaceutical Research & Development LLC.; Lumosity; Lundbeck; Merck & Co., Inc.; Meso Scale Diagnostics, LLC.; NeuroRx Research; Neurotrack Technologies; Novartis Pharmaceuticals Corporation; Pfizer Inc.; Piramal Imaging; Servier; Takeda Pharmaceutical Company; and Transition Therapeutics. The Canadian Institutes of Health Research is providing funds to support ADNI clinical sites in Canada. Private sector contributions are facilitated by the Foundation for the National Institutes of Health (http://www.fnih.org). The grantee organization is the Northern California Institute for Research and Education, and the study is coordinated by the Alzheimer’s Therapeutic Research Institute at the University of Southern California. ADNI data are disseminated by the Laboratory for Neuro Imaging at the University of Southern California.
Ethics declarations
Competing interests
J.S.Y. and L.W.B. serve on the editorial team for npj Dementia.
Ethical approval
All ADNI research activities were approved by Institutional Review Boards at each patient recruitment site.
Informed consent
Written informed consent was obtained from all patients.
Additional information
Publisher’s note Springer Nature remains neutral with regard to jurisdictional claims in published maps and institutional affiliations.
Supplementary information
Rights and permissions
Open Access This article is licensed under a Creative Commons Attribution 4.0 International License, which permits use, sharing, adaptation, distribution and reproduction in any medium or format, as long as you give appropriate credit to the original author(s) and the source, provide a link to the Creative Commons licence, and indicate if changes were made. The images or other third party material in this article are included in the article’s Creative Commons licence, unless indicated otherwise in a credit line to the material. If material is not included in the article’s Creative Commons licence and your intended use is not permitted by statutory regulation or exceeds the permitted use, you will need to obtain permission directly from the copyright holder. To view a copy of this licence, visit http://creativecommons.org/licenses/by/4.0/.
About this article
Cite this article
Bonham, L.W., Sirkis, D.W., Pang, A.P.S. et al. DNA methylation age from peripheral blood predicts progression to Alzheimer’s disease, white matter disease burden, and cortical atrophy. npj Dement. 1, 7 (2025). https://doi.org/10.1038/s44400-025-00007-1
Received: 16 October 2024
Accepted: 21 March 2025
Published: 27 May 2025
DOI: https://doi.org/10.1038/s44400-025-00007-1


