.png)

Lion Cove is Intel’s latest high performance CPU architecture. Compared to its predecessor, Raptor Cove, Intel’s newest core can sustain more instructions per cycle, reorganizes the execution engine, and adds an extra level to the data cache hierarchy. The list of changes goes on, with tweaks to just about every part of the core pipeline. Lion Cove does well in the standard SPEC CPU2017 benchmark suite, where it posts sizeable gains especially in higher IPC subtests. In the Arrow Lake desktop platform, Lion Cove can often go head-to-head against AMD’s Zen 5, and posts an overall lead over Intel’s prior Raptor Cove while pulling less power. But a lot of enthusiasts are interested in gaming performance, and games have different demands from productivity workloads.

Here, I’ll be running a few games while collecting performance monitoring data. I’m using the Core Ultra 9 285K with DDR5-6000 28-36-36-96, which is the fastest memory I have available. E-Cores are turned off in the BIOS, because setting affinity to P-Cores caused massive stuttering in Call of Duty. In Cyberpunk 2077, I’m using the built-in benchmark at 1080P and medium settings, with upscaling turned off. In Palworld, I’m hanging out near a base, because CPU load tends to be higher with more entities around.
Gaming workloads generally fall at the low end of the IPC range. Lion Cove can sustain eight micro-ops per cycle, which roughly corresponds to eight instructions per cycle because most instructions map to a single micro-op. It posts very high IPC figures in several SPEC CPU2017 tests, with some pushing well past 4 IPC. Games however get nowhere near that, and find company with lower IPC tests that see their performance limited by frontend and backend latency.
Top-down analysis characterizes how well an application is utilizing a CPU core’s width, and accounts for why pipeline slots go under-utilized. This is usually done at the rename/allocate stage, because it’s often the narrowest stage in the core’s pipeline, which means throughput lost at that stage can’t be recovered later. To briefly break down the reasons:
Bad Speculation: Slot was utilized, but the core was going down the wrong path. That’s usually due to a branch mispredict.
Frontend Latency: Frontend didn’t deliver any micro-ops to the renamer that cycle
Frontend Bandwidth: The frontend delivered some micro-ops, but not enough to fill all renamer slots (eight on Lion Cove)
Core Bound: The backend couldn’t accept more micro-ops from the frontend, and the instruction blocking retirement isn’t a memory load
Backend Memory Bound: As above, but the instruction blocking retirement is a memory load. Intel only describes the event as “TOPDOWN.MEMORY_BOUND_SLOTS” (event 0xA4, unit mask 0x10), but AMD and others explicitly use the criteria of a memory load blocking retirement for their corresponding metrics. Intel likely does the same.
Retiring: The renamer slot was utilized and the corresponding micro-op was eventually retired (useful work)

Core width is poorly utilized, as implied by the IPC figures above. Backend memory latency accounts for a plurality of lost pipeline slots, though there’s room for improvement in instruction execution latency (core bound) and frontend latency as well. Bad speculation and frontend bandwidth are not major issues.
Lion Cove has a 4-level data caching setup, with the L1 data cache split into two levels. I’ll be calling those L1 and L1.5 for simplicity, because the second level of the L1 lands between the first level and the 3 MB L2 cache in capacity and performance.

Lion Cove’s L1.5 catches a substantial portion of L1 misses, though its hitrate isn’t great in absolute terms. It gives off some RDNA 128 KB L1 vibes, in that it takes some load off the L2 but often has mediocre hitrates. L2 hitrate is 49.88%, 71.87%, and 50.98% in COD, Palworld, and Cyberpunk 2077 respectively. Cumulative hitrate for the L1.5 and L2 comes in at 75.54%, 85.05%, and 85.83% across the three games. Intel’s strategy of using a larger L2 to keep traffic off L3 works to a certain extent, because most L1 misses are serviced without leaving the core.

However, memory accesses that do go to L3 and DRAM are very expensive. Lion Cove can provide an idea of how often each level in the memory hierarchy limits performance. Specifically, performance monitoring events count cycles where no micro-ops were ready to execute, a load was pending from a specified cache level, and no loads missed that level of cache. For example, a cycle would be L3 bound if the core was waiting for data from L3, wasn’t also waiting for data from DRAM, and all pending instructions queued up in the core were blocked waiting for data. An execute stage stall doesn’t imply performance impact, because the core has more execution ports than renamer slots. The execute stage can race ahead after stalling for a few cycles without losing average throughput. So, this is a measurement of how hard the core has to cope, rather than whether it was able to cope.
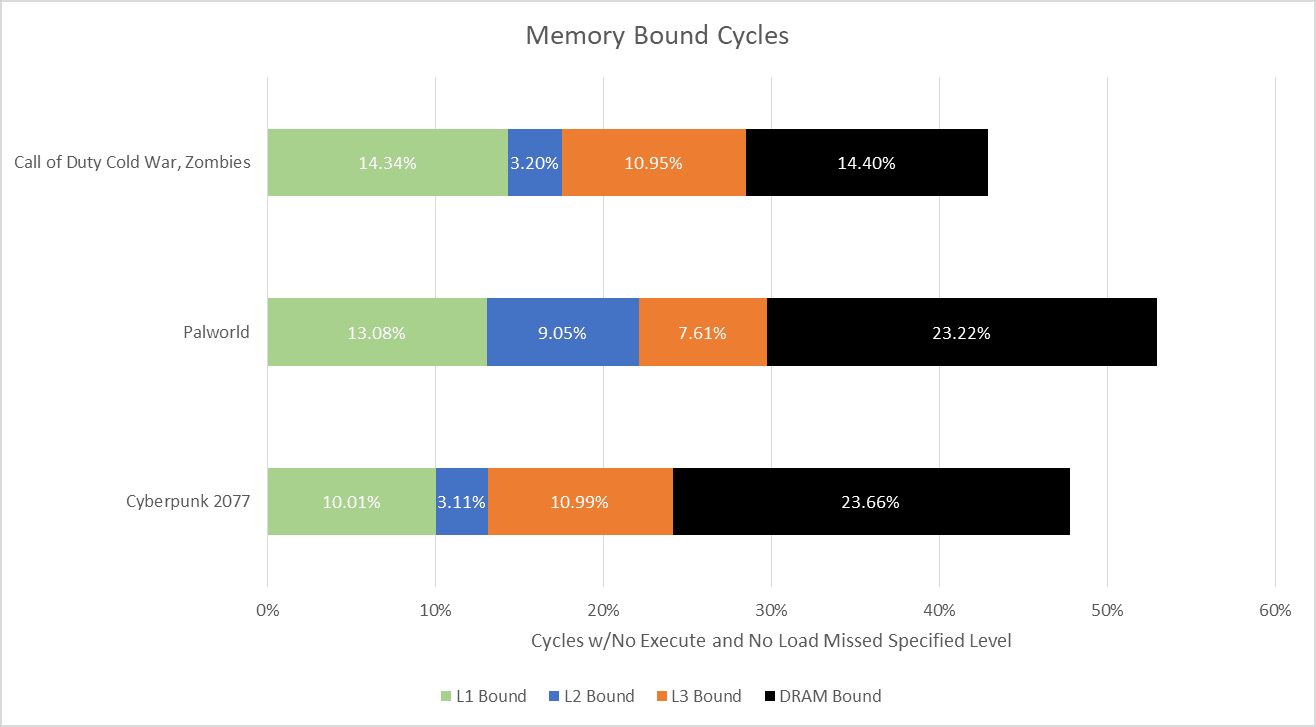
Intel’s performance events don’t distinguish between L1 and L1.5, so both are counted as “L1 Bound” in the graph above. The L1.5 seems to move enough accesses off L2 to minimize the effect of L2 latency. Past L2 though, L3 and DRAM performance have a significant impact. L2 misses may be rare in an absolute sense, but they’re not quite rare enough considering the high cost of a L3 or DRAM access.

Lion Cove and the Arrow Lake platform can monitor queue occupancy at various points in the memory hierarchy. Dividing occupancy by request count provides average latency in cycles, giving an idea of how much latency the core has to cope with in practice.
Count occurrences (rising-edge) of DCACHE_PENDING sub-event0. Impl. sends per-port binary inc-bit the occupancy increases* (at FB alloc or promotion).
Intel’s description for the L1D_MISS.LOAD event, which unhelpfully doesn’t indicate which level of the L1 it counts for.
These performance monitoring events can be confusing. The L1D_MISS.LOAD event (event 0x49, unit mask 1) increments when loads miss the 48 KB L1D. However the corresponding L1D_PENDING.LOAD event (event 0x48, unit mask 1) only accounts for loads that miss the 192 KB L1.5. Using both events in combination treats L1.5 hits as zero latency. It does accurately account for latency to L2 and beyond, though only from the perspective of a queue between the L1.5 and L2.
Measuring latency at the arbitration queue (ARB) can be confusing in a different way. The ARB runs at the CPU tile’s uncore clock, or 3.8 GHz. That’s well below the 5.7 GHz maximum CPU core clock, so the ARB will see fewer cycles of latency than the CPU core does. Therefore, I’m adding another set of bars with post-ARB latency multiplied by 5.7/3.8, to approximate latency in CPU core cycles.
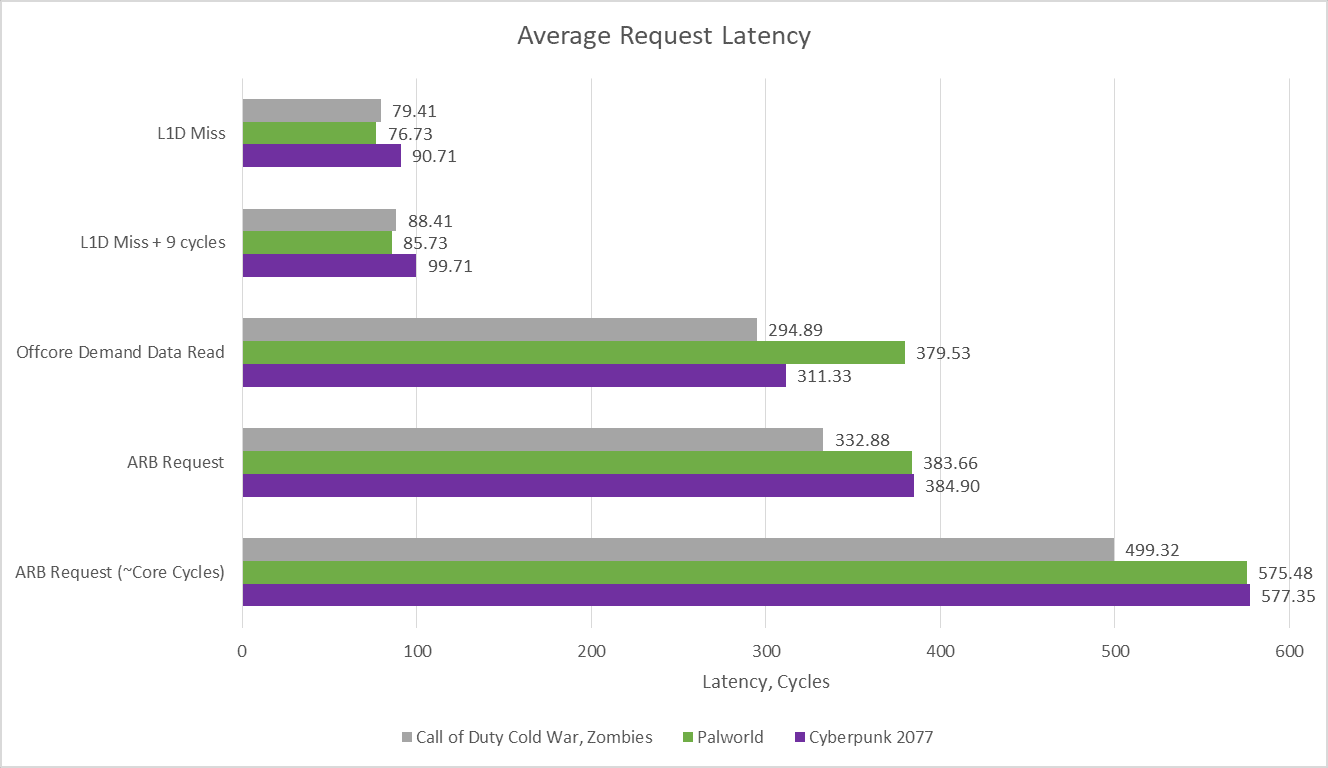
Another way to get a handle on latency is to multiply by cycle time to approximate actual latency. Clocks aren’t static on Arrow Lake, so there’s additional margin of error. But doing so does show latency past the ARB remains well controlled, so DRAM bandwidth isn’t a concern. If games were approaching DRAM bandwidth limits, latency would go much higher as requests start piling up at the ARB queue and subsequent points in the chip’s interconnect.

Much of the action happens at the backend, but Lion Cove loses some throughput at the frontend too. Instruction-side accesses tend to be more predictable than data-side ones, because instructions are executed sequentially until the core reaches a branch. That means accurate branch prediction can let the core hide frontend latency.

Lion Cove’s branch predictor enjoys excellent accuracy across all three games. Mispredicts however can still be an issue. Just as the occasional L3 or DRAM access can be problematic because they’re so expensive, recovering from a branch mispredict can hurt too. Because a mispredict breaks the branch predictor’s ability to run ahead, it can expose the core to instruction-side cache latency. Fetching the correct branch target from L2 or beyond could add dozens of cycles to mispredict recovery time. Ideally, the core would contain much of an application’s code footprint within the fastest instruction cache levels to minimize that penalty.
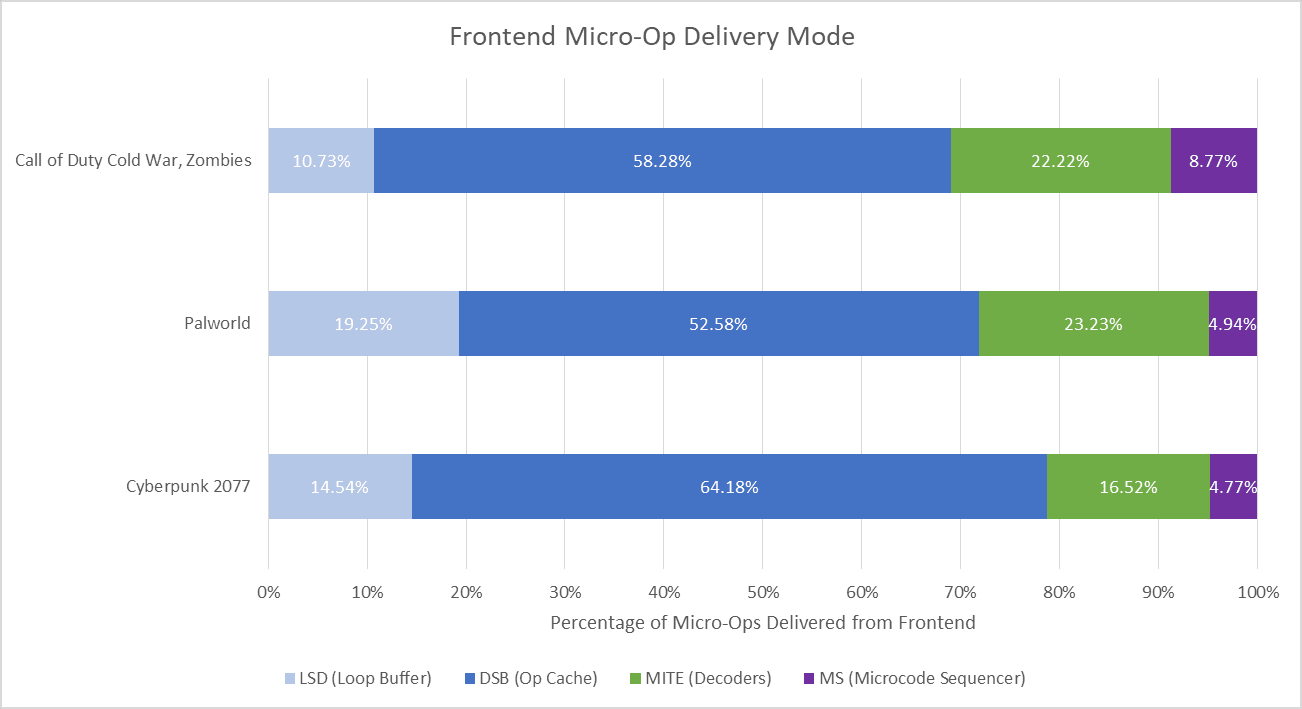
Lion Cove’s frontend can source micro-ops from four sources. The loop buffer, or Loop Stream Detector (LSD) and microcode sequencer play a minor role. Most micro-ops come from the micro-op cache, or Decoded Stream Buffer (DSB). Even though the op cache delivers a majority of micro-ops, it’s not large enough to serve as the core’s primary instruction cache. Lion Cove gets a 64 KB instruction cache, carried over from Redwood Cove. Intel no longer documents events that would allow a direct L1i hitrate calculation. However, older events from before Alder Lake still appear to work. Micro-op cache hits are counted as instruction cache hits from testing with microbenchmarks. Therefore, figures below indicate how often instruction fetches were satisfied without going to L2.

The 64 KB instruction cache does its job, keeping the vast majority of instruction fetches from reaching L2. Code hitrate from L2 is lower, likely because accesses that miss L1i have worse locality in the first place. Instructions also have to contend with data for L2 capacity. L2 code misses don’t happen too often, but can be problematic just as on the data side because of the dramatic latency jump.
Among the three games here, Cyberpunk 2077’s built-in benchmark has better code locality, while Palworld suffers the most. That’s reflected in average instruction-side latency seen by the core. When running Palworld, Lion Cove takes longer to recover from pipeline resteers, which largely come from branch mispredicts. Recovery time here refers to cycles elapsed until the renamer issues the first micro-op from the correct path.

Offcore code read latency can be tracked in the same way as demand data reads. Latency is lower than on the data side, suggesting higher code hitrate in L3. However, hiding hundreds of cycles of latency is still a tall order for the frontend, just as it is for the backend. Again, Lion Cove’s large L2 does a lot of heavy lifting.

Performance counters provide insight into other delays as well. A starts with the renamer (allocator) restoring a checkpoint with known-good state[1], which takes 3-4 cycles and as expected, doesn’t change across the three games. Lion Cove can also indicate how often the instruction fetch stage stalls. Setting the edge/cmask bits can indicate how long each stall lasts. However, it’s hard to determine the performance impact from L1i misses because the frontend has deep queues that can hide L1i miss latency. Furthermore, an instruction fetch stall can overlap with a backend resource stall.

While pipeline resteers seem to account for the bulk of frontend-related throughput losses, other reasons can contribute too. Structures within the branch predictor can override each other, for example when a slower BTB level overrides a faster one (BPClear). Large branch footprints can exceed the branch predictor’s capacity to track them, and cause a BAClear in Intel terminology. That’s when the frontend discovers a branch not tracked by the predictor, and must redirect instruction fetch from a later stage. Pipeline bubbles from both sources have a minor impact, so Lion Cove’s giant 12K entry BTB does a good job.
In a latency bound workload like gaming, the retirement stage operates in a feast-or-famine fashion. Most of the time it can’t do anything. That’s probably because a long latency instruction is blocking retirement, or the ROB is empty from a very costly mispredict. When the retirement stage is unblocked, throughput resembles a bathtub curve. Often it crawls forward with most retire slots idle. The retirement stage spends very few cycles retiring at medium-high throughput.

Likely, retirement is either crawling forward in core-bound scenarios when a short latency operation completes and unblocks a few other micro-ops that complete soon softer, or is bursting ahead after a long latency instruction completes and unblocks retirement for a lot of already completed instructions.

Lion Cove can retire up to 12 micro-ops per cycle. Once it starts using its full retire width, the core on average blasts through 28 micro-ops before getting blocked again.
Compared to Zen 4, Lion Cove suffers harder with backend memory latency, but far less from frontend latency. Part of this can be explained by Zen 4’s stronger data-side memory subsystem. The AMD Ryzen 9 7950X3D I previously tested on has 96 MB of L3 cache on the first die, and has lower L3 latency than Lion Cove in Intel’s Arrow Lake platform. Beyond L3, AMD achieves better load-to-use latency even with slower DDR5-5600 36-36-36-89 memory. Intel’s interconnect became more complex when they shifted to a chiplet setup, and there’s clearly some work to be done.
Lion Cove gets a lot of stuff right as well, because the core’s frontend is quite strong. The larger BTB and larger instruction cache compared to Zen 4 seem to do a good job of keeping code fetches off slower caches. Lion Cove’s large L2 gets credit too. It’s not perfect, because the occasional instruction-side L2 miss has an average latency in the hundreds of cycles range. But Intel’s frontend improvements do pay off.
Even though Intel and AMD have different relative strengths, a constant factor is that games are difficult, low IPC workloads. They have large data-side footprints with poor access locality. Instruction-side accesses are difficult too, though not to the same extent because modern branch predictors can mostly keep up. Both factors together mean many pipeline slots go unused. Building a wider core brings little benefit because getting through instructions isn’t the problem. Rather, the challenge is in dealing with long stalls as the core waits for data or instructions to arrive from lower level caches or DRAM. Intel’s new L1.5 likely has limited impact as well. It does convert some already fast L2 hits into even faster accesses, but it doesn’t help with long stalls as the core waits for data from L3 or DRAM.
Comparing games to SPEC CPU2017 also emphasizes that games aren’t the only workloads out there. Wider cores with faster upper level caches can pay off in a great many SPEC CPU2017 tests, especially those with very high IPC. Conversely, a focus on improving DRAM performance or increasing last level cache capacity would provide minimal gains for workloads that already fit in cache. Optimization strategies for different workloads are often in conflict, because engineers must decide where to allocate a limited power and area budget. They have limited time to determine the best tradeoff too. Intel, AMD, and others will continue to tune their CPU designs to meet expected workloads, and it’ll be fun to see where they go.
If you like the content then consider heading over to the Patreon or PayPal if you want to toss a few bucks to Chips and Cheese. Also consider joining the Discord.
Henry Wong suggests the INT_MISC.RECOVERY_CYCLES event, which is present on Lion Cove as well as Haswell, accounts for time taken for a mapping table recovery. The renamer maintains a register alias table (mapping) that maps architectural registers to renamed physical registers. Going back to a known good state would mean restoring a previous version of the table prior to the mispredicted branch. https://www.stuffedcow.net/files/henry-thesis-phd.pdf