.png)

If you’ve been an engineer for any length of time, then you’ll probably recognize these truths about software.
It’s not predictable. Estimations are hard unless you’ve done it before. And if you’ve done it before, it already exists.
Requirements are in constant flux. The customer is always right, except when their telling you how to design a feature.
Shit happens. A library has a security vulnerability, a bug appears in the core algorithm or simply Patch Tuesday causes some unknown impact. Software is in constant change.
However, outside of the software bubble, management want to understand the engine is functioning well and want a graph going up and to the right.
We’ve moved beyond measuring lines of code and we’re starting to see sophisticated approaches such as DORA or the DX Core metrics which fill the void and provide measures that correlate with business success. Win! However, this doesn’t change the facts. Software development is messy and there aren’t any silver bullets to make it go faster.
Which is why I was delighted to see a paper entitled, “No silver bullets: Why understanding software cycle time is messy, not magic” which analyzes cycle time and concludes that “improving software delivery velocity likely requires systems-level thinking rather than individual-focused interventions”.
Cycle time is the duration between a ticket opening and a ticket closed, and at least one group of engineering leaders thought it was the most useful engineering productivity metric. I definitely see the attraction too - faster cycle time presumably means we try more things, which means we’ll validate more ideas with our customers and profit! Maybe…
The folks behind the paper analysed a data set of nearly 12000 contributors at over 200 organizations with the goal of finding the factors that impact cycle time, and how much variation is there? Data was analysed from both an individual and team perspective.
How’d you improve cycle time? There’s lots of obvious sounding things. Spend more time coding, and less time in meetings! Review PRs faster by collaborating more heavily. Break things down into tiny pieces (and one for those disconnected from the work, type faster!).
Obvious sounding things aren’t necessarily right though, and the study digs into these variables in more detail. As the measures come from a tool, they can lack a little context, but certainly better than guessing!
Coding days is measured as the average number of days per week that a developer made at least one commit (a little weak in my opinion, perhaps flow-time would have been a more useful metric?)
Task scoping was measured by the total number of pull requests merged (more PRs merged implies better task scoping, or perhaps more off the books work?)
Collaboration was measured by interactions on pull requests, together with the depth of comments on each pull request.
Defects were measured as a percentage of tickets that were defect tickets.
Here’s the results of the analysis:
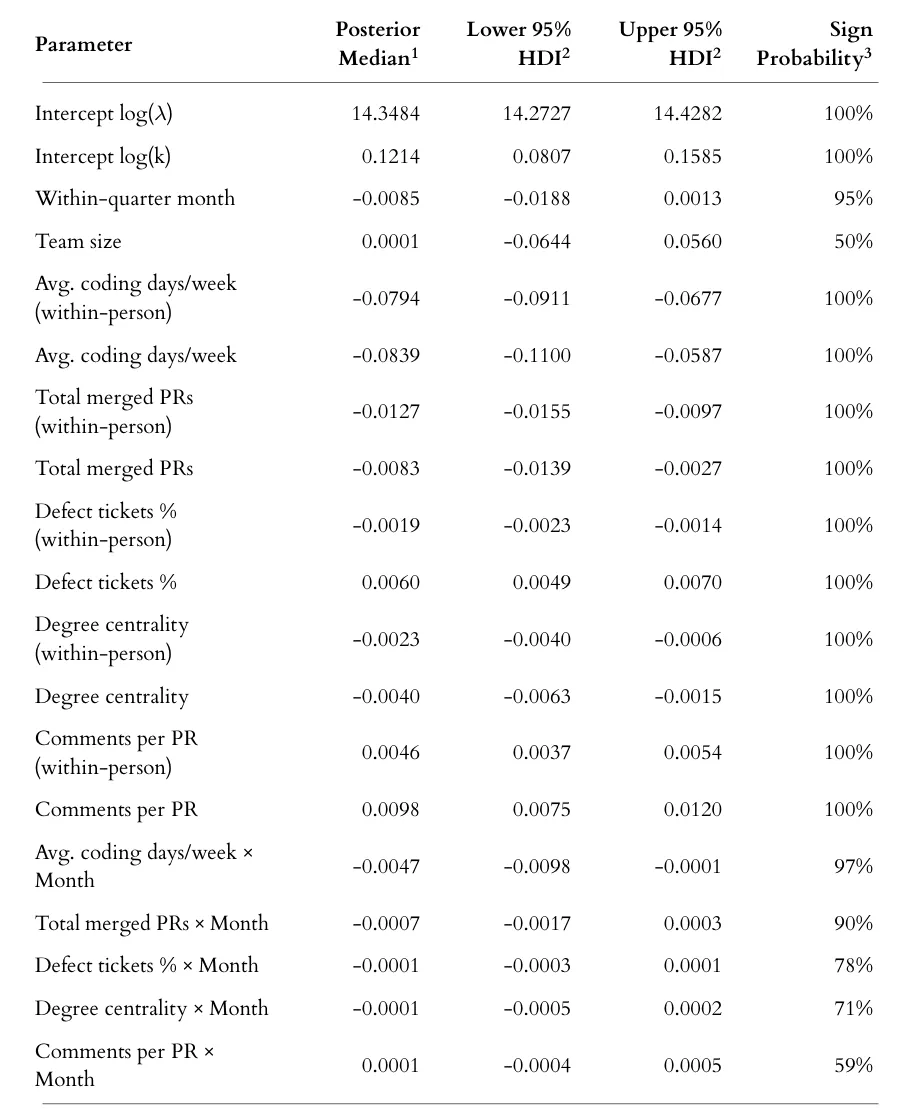
Let’s look at the total merged PRs. The posterior median is the best estimate of effect size (-0.0083 - e.g. a small decrease in cycle time) and it’s bounded by a range from -0.0139 to -0.0027 (95% of the values we have confidence in are in this range). Finally, the sign probability gives us a measure of confidence in the direction of the the impact.
So, what can we say with confidence?
More merged PRs reduce cycle time
More comments Per PR increase cycle time.
More coding days per week reduce cycle time
More defects increase cycle time.
Greater collaboration reduces cycle time
Spend more time coding, break it into small chunks and work with others. Case closed?
While all these factors do affect cycle time in expected ways, the effects are tiny compared to the enormous variability in the data. More importantly, the variation within a single developer from month to month is so large that it makes comparing developers almost meaningless.
The "10x developer" meme assumes there are stable, measurable differences between developers. But this research shows that a developer's cycle time varies so much over time that any snapshot measurement tells you almost nothing about their "true" performance (at least by these measures).
Caveat: One thing this doesn’t track (because you can’t!) is untracked work. There’s a believable (at least to me) interpretation which involves some developers finishing tasks early, and then getting the “off-books” work done (improve the build, fix the gnarly mess left behind, scratch the itch with a refactoring). It’s a rare company indeed that manages all the work in the system, since the system itself creates the demand (POTIWID).
Making a relatively unsophisticated monthly average of an individual developer's cycle time data is not likely to be able to tell you what their cycle time will be like in the future. The noise overwhelms the signal. Software development is inherently variable because estimation is hard, context changes constantly and shit happens.
The authors put it beautifully:
Practitioners can use this research to feel justified in seeking more shared and environmental explanations for the speed of work while doing complex software development, rather than locating their explanations in individual blame, or praise.
Instead of thinking about developer productivity as a fixed attribute , we should think of it more like weather, highly variable, influenced by countless factors, and only predictable in aggregate over long time periods. We can do this by:
Look at team-level trends over months, not individual snapshots
Focus on system improvements, not individual interventions
Accept that variability is normal, not a sign of inconsistency
As the paper concludes: Improving software delivery velocity likely requires systems-level thinking rather than individual-focused interventions.
Cycle-time is seductive in its simplicity: it’s easy to measure and draw graphs. But that simplicity is in itself a problem, leading to incorrect assumptions especially by those who aren’t close to the context. A single cycle-time for a ticket is like a snapshot in a evolving situation; sure you captured something, but what does it mean?
Software delivery is no different. We build in variability to control the system (attenuation!) reviews, merges, tests, context-switching. Individual cycle-times may spike or dip, but rarely because of anything more than normal noise.
That’s why aggregate trends matter. Look at team-level cycle time over months. Chart monthly distribution bands and most importantly pair them with qualitative signals.