.png)

Introduction
To address the threat of climate change, the Paris Agreement was adopted in 2015 to limit global temperature rise over pre-industrial levels to well below 2 °C, while striving to keep it below 1.5 °C by 2100. This goal is to be achieved through international cooperation, with each country committing to its own nationally determined contributions (NDCs) to reductions in greenhouse gas emissions, primarily CO2.
The agreement is implemented in the context of the Intergovernmental Panel on Climate Change (IPCC), which periodically issues integrated assessment reports to monitor progress, most recently in 20211. The IPCC projects future climate change by first using socioeconomic scenarios to project future greenhouse gas emissions, which are then fed into global climate models to simulate their impact on temperature and other climate variables1.
The IPCC projects carbon emissions using deterministic expert-based scenarios, called representative concentration pathways (RCPs) in the 2014 assessment2,3, and shared socioeconomic pathways (SSPs) in the 2021 assessment1,4. These scenarios do not have a statistical or probabilistic interpretation, but are instead designed to span a wide range of emission trajectories and associated climate responses, including outcomes under high climate sensitivity.
In 2017, Raftery et al.5 published a fully statistical probabilistic approach to projecting emissions and temperature change. They estimated that, on current trends, the probability of keeping global temperature rise below 2 °C was only 5%, and just 1% for staying below 1.5 °C. This analysis involved forecasting population using the set of Bayesian hierarchical models used by the United Nations to forecast poulation for all countries since 20156,7, and forecasting GDP per capita and carbon intensity using a joint Bayesian hierarchical model, estimated using data from 1960 to 2010. The authors combined these forecasts to obtain a probabilistic forecast of carbon emissions. They then estimated global temperature rise based on the linear relationship between temperature and cumulative carbon emissions described by the IPCC3.
To determine what would need to be done to meet the goal at both global and national levels, Liu and Raftery8 updated their projections with data up to 2015, based on countries’ initial nationally determined contributions—that is, the first round of emissions reduction targets submitted under the Paris Agreement, which we refer to as NDC-1s. These targets typically set emissions goals for the year 2030. For countries that had not yet ratified the Paris Agreement at that time and thus had not submitted an official NDC, we treat their Intended Nationally Determined Contribution (INDC) as their initial NDC. They found that under current trends, the probability of keeping global warming below 2 °C by 2100 was still just 5%. But if all countries fulfilled their NDC-1s and continued reducing emissions at the same rate after 2030, this probability would increase to 26%. To reach a 50% chance of staying below 2 °C this century, the rate of reductions in the global emissions rate would have needed to accelerate from 1% to 1.8% per year.
In addition to projecting global temperature change, this approach has been used to produce local probabilistic climate projections9 and projections of the number of hot days in given locations10. It has also been used for the assessment of the social cost of carbon11,12.
Other methods have been used to assess future prospects for climate change. Some studies have used Integrated Assessment Models13,14 and the CO-STIRPAT dynamic system15,16 to simulate global CO2 emissions. Machine learning and Bayesian approaches have also been applied to CO2 projections17,18. Hausfather et al., (2022)19 have summarized research on concerns about meeting the Paris Agreement’s climate targets given current policies.
Some studies, which primarily aimed to project the future outcome based on NDCs and net-zero targets, have been optimistic about achieving the Paris Agreement’s target20,21. However, other studies have argued that achieving net zero is unlikely given current trends22,23,24. Note that these two sets of studies are not directly comparable, as their purposes are different.
Data from the first nine years of the Paris Agreement’s operation, from 2016 to 2024, are now available, allowing us to assess how the outlook for its success has evolved. We do this by extending and updating the methodology and data for the probabilistic approach5,8. We use data on population, GDP per capita, and carbon intensity for all countries considered up to 2024, as opposed to 2015 previously. The approach previously used estimated climate sensitivities for each climate model in the Coupled Model Intercomparison Project Phase 5 (CMIP5)8. Instead, here we predict the temperature based on its linear relationship with cumulative carbon emission given by the Transient Climate Response to cumulative CO2 Emissions (TCRE) recommended by the IPCC’s 6th Assessment Report25, based on the updated CMIP6 set of climate models.
Results
Carbon emissions, NDCs, and probabilistic forecasts since 2015
Figure 1a shows the probabilistic forecasts of worldwide CO2 emissions as of the Paris Agreement adoption in 2015, and what has happened since, compared with the NDC-1s. The NDC-1s targeted an average decline of 0.8% per annum, which translates to a decline of 7% over the nine years. Instead, what happened was an increase of 5.6%, or an average increase of 0.6% per year. This was very close to the median probabilistic forecast of 5.3%, which was based on trends from 1960 to 20158.
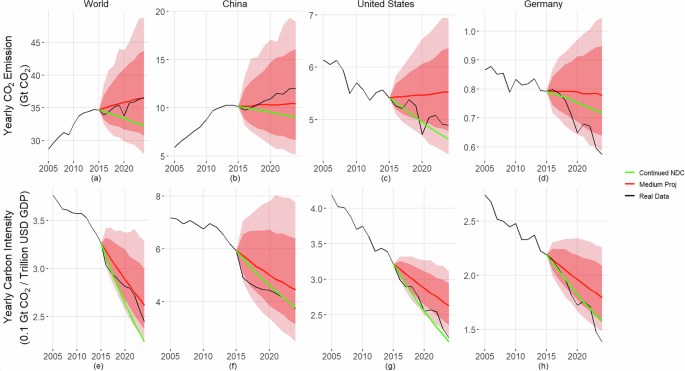
Probabilistic projections of CO2 emissions (top row) and carbon intensity for 2016–2024 (bottom row), based on data for 1960–2015: median projection (solid red line), 90% interval (very likely range—dark shaded area), 99% interval (virtually certain-light shaded area), observed emissions (black line), and emissions needed to meet the national defined contribution (NDC-1) target (green line). The columns correspond to the world, China, the United States, and Germany. The panels are: a Yearly CO2 emissions for the world in Gt CO2; b Yearly CO2 emissions for China in Gt CO2; c Yearly CO2 emissions for the United States in Gt CO2; d Yearly CO2 emissions for Germany in Gt CO2; e Yearly carbon intensity for the world, in Gt CO2 per US $100 billion; (f) Yearly carbon intensity for China, in Gt CO2 per US $100 billion; (g) Yearly carbon intensity for the United States, in Gt CO2 per US $100 billion; h Yearly carbon intensity for Germany, in Gt CO2 per US $100 billion.
If we look at carbon intensity, however, a different story emerges. The median projection was for a decrease (i.e., improvement) of 20% over the nine years 2015-2024, with a very likely range (90% interval) of 8–27%, while the NDC-1s aimed for a somewhat greater decrease of 31%. In fact, there was a decrease of 25%, greater than the expected decrease, but well within the very likely range from the probabilistic forecast. This corresponds to 3.1% per year, considerably faster than the previous historic average of 1.1% from 1960–2015.
So 2015–2024 was a period of significant progress in reducing carbon intensity, widely viewed as the only one of the three components in the IPAT equation26,27 under potential policy control5, even if reductions did not fully meet the NDC-1s. Given that, how can it be that not only did emissions not go down, but they actually increased substantially over the immediate post-Paris period? The answer is that world GDP (on a purchasing power parity, or PPP basis) increased fast over this period, by 41%, or 3.9% per year. This more than canceled out the 3.1% annual improvement in carbon intensity. This illustrates one way in which climate change is a “super wicked problem”28, in that fast economic growth, an aspiration of many governments and societies, has led to dramatic backsliding on carbon emissions since the Paris Agreement was adopted.
The rest of Fig. 1 illustrates the varying patterns in three leading world economies. China’s NDC-1 was expressed in terms of carbon intensity rather than total emissions, and targeted a 36% decrease by 2024. This was met and indeed slightly exceeded, with a 37% decrease. The median projection was for a 25% decrease, but the observation was well within the very likely range. In spite of this excellent performance in terms of carbon intensity, carbon emissions increased by a massive 18%, or 2.2% per year, due to China’s exceptionally fast economic growth. The USA came somewhat close to meeting its NDC-1, reducing total emissions by 10%, compared to its NDC-1 of a 15% reduction. This was much better than the median projection of a 2% increase, but was still within the very likely range. Nevertheless, it suggests that the measures taken in response to the Paris Agreement had an effect. Carbon intensity decreased by a substantial 32%, or 4.2% per year, very close to the 34% implied by its NDC-1, and much more than the projected 18%. Germany’s CO2 emissions declined by 28% over the period, compared with the 9% called for by the NDC-1 and a median projection of a mere 2%. Its carbon intensity declined by 37%.
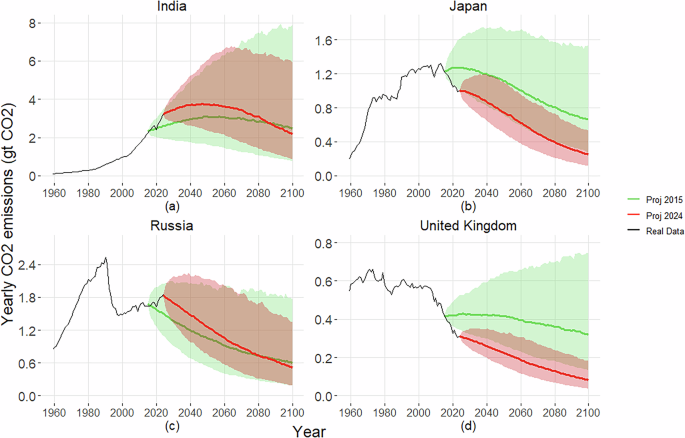
China, the USA, and Germany had similar percentage declines in carbon intensity over the period 2015–2024, in the range of 32–37% declines over the nine-year period. However, it is of interest to compare their absolute carbon intensity levels, which are very different from one another. Germany had by far the lowest carbon intensity (in 2024) of these three countries. The USA’s carbon intensity was about 50% higher than that of Germany, while that of China was over three times that of Germany. That of Germany was similar to those of other major European countries. This suggests that there is substantial scope for China and the USA, as well as other countries with high carbon intensities, to improve massively and rapidly. Similar results for India, Japan, Russia, and the United Kingdom are shown in Fig. 2. We also include the probabilistic projections of GDP for the world and the seven countries featured in Fig. 3.
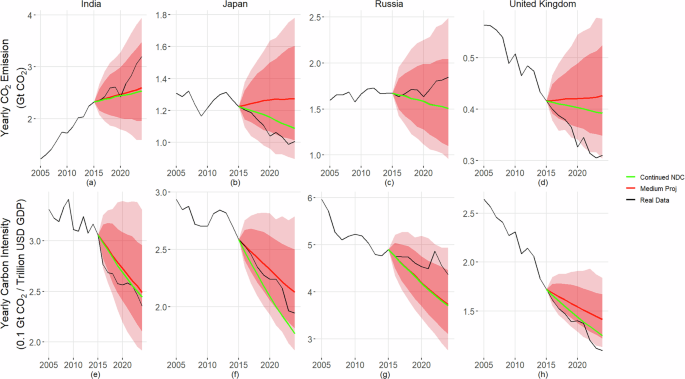
Probabilistic projections of annual CO2 emissions (top row) and carbon intensity (bottom row) for 2016–2024, based on data for 1960–2015: median projection (solid red line), 90% interval (very likely range—dark shaded area), 99% interval (virtually certain—light shaded area), observed emissions (black line), emissions needed to meet the national defined contribution (NDC-1) target (green line). The columns correspond to India, Japan, Russia, and the United Kingdom. The panels are: a Yearly CO2 emissions for India, in Gt CO2; b Yearly CO2 emissions for Japan, in Gt CO2; c Yearly CO2 emissions for Russia, in Gt CO2; d Yearly CO2 emissions for the United Kingdom, in Gt CO2; e Yearly carbon intensity for India, in Gt CO2 per US $100 billion; f Yearly carbon intensity for Japan, in Gt CO2 per US $100 billion; g Yearly carbon intensity for Russia, in Gt CO2 per US $100 billion; h Yearly carbon intensity for the United Kingdom, in Gt CO2 per US $100 billion.
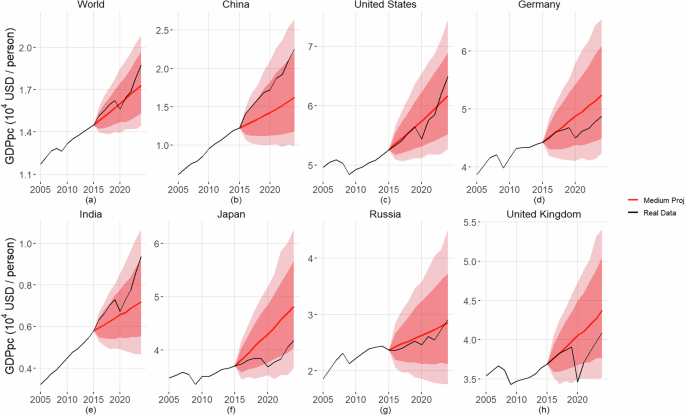
Probabilistic projections of GDP per capita (2016-2024) for a the world, b China, c United States, d Germany, e India, f Japan, g Russia, and h United Kingdom. The projections are based on data for 1960–2015: median projection (solid red line), 90% interval (very likely range—dark shaded area), 99% interval (virtually certain-light shaded area), and observed values (black line). GDP per capita is expressed in 104 USD in 2011 purchasing power parity (PPP) per person.
Implications for projections of future carbon emissions
What are the implications of these recently observed carbon emissions for projections of the future? Based on data to 2015, the median projection was that annual emissions would decline by only 10% over the rest of the century. However, Fig. 4 shows that a much larger decrease, of 64%, is now projected. This reflects the acceleration in the decline of carbon intensity since the Paris Agreement was adopted.
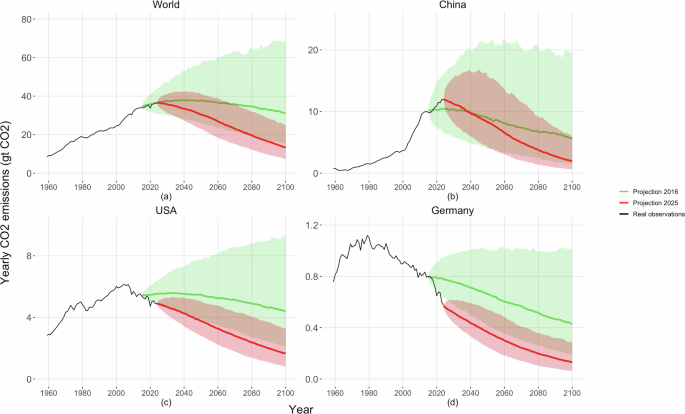
Probabilistic projections of yearly CO2 emissions starting in 2016 based on data from 1960–2015 (green), and starting in 2025 based on data from 1960–2024 (pink), for a the world, b China, c the United States, and d Germany.
Uncertainty about future emissions has also declined dramatically, with the very likely range for 2100 being 15–71 Gt CO2 based on data to 2015, but 7–25 Gt based on data to 2024. Thus, the width of the interval has gone down from 56 Gt to 18 Gt, a 75% decrease in uncertainty due to the additional data for 2016-2024. Concretely, in 2015, it was plausible that global annual emissions could increase to as much as 71 Gt in 2100, but now it is unlikely that they would exceed 25 Gt. It is also unlikely that annual emissions would go below 7 Gt on current trends, making global net zero emissions unlikely this century on current trends, even given the recently improved prospects for carbon intensity. China, the USA, and Germany show similar patterns of change in emissions to the world as a whole, and even China is projected to see its emissions lower than previously expected. Similar plots for India, Japan, Russia, and the UK are shown in Fig. 5.
Probabilistic projections of yearly CO2 emissions starting in 2016 based on data from 1960–2015 (green), and starting in 2025 based on data from 1960–2024 (pink), for a India, b Japan, c Russia, and d United Kingdom.
One important question is when greenhouse gas emissions will peak. For example, the IPCC states that emissions must peak before 2025 to have a good chance of limiting global temperature rises to 1.5–2 °C29. Figure 6 provides a partial answer by showing the posterior predictive distribution of the year of peak carbon emissions. It shows that the most likely peak year is 2024, but with probability only 22%. Carbon emissions are very likely to peak by 2045, but there is considerable uncertainty about when. This is in line with the widely varying predictions that have been made. For example, Fyson et al. 30 assess that the probability of peaking in 2024 is 70%, in contrast with Friedlingstein et al. 31, who are more pessimistic and note that fossil CO2 emissions are still increasing with no sign of peaking.
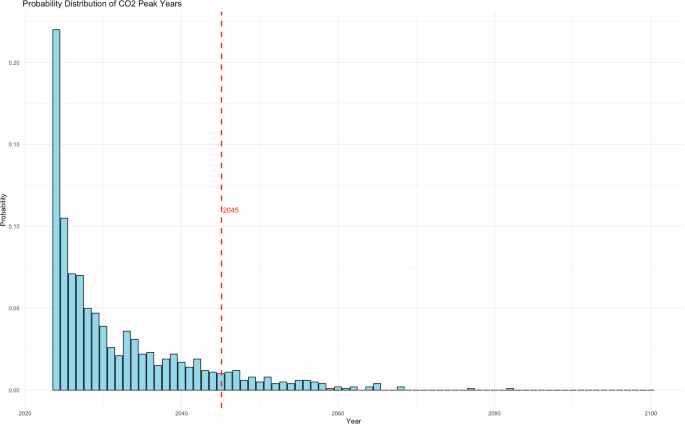
Probability of CO2 emissions peaking in each year from 2024 to 2100. The vertical dashed red line indicates the 90th percentile of the distribution, which is at 2045.
Implications for climate change
Figure 7 shows the implications of these results for global average temperature change. Based on data to 2015, the expected increase by 2100 was 2.6 °C, with a very likely range 1.6–3.9 °C. (Note that these numbers differ slightly from those in Liu and Raftery8, due to the updated methods and data; see the Methods section.) Based on data to 2024, the expected increase had gone down to 2.4 °C, with a very likely range of 1.7–3.2 °C. We see that, disappointingly, in spite of the substantial decrease in expected yearly emissions by 2100, the expected temperature increase by 2100 declined by only 0.2 °C. This reflects the extent to which future climate change is already baked in, and also the fact that the biggest reductions will happen later in the century, and hence will have a smaller impact on cumulative (rather than yearly) emissions, which is the determining quantity for climate change.
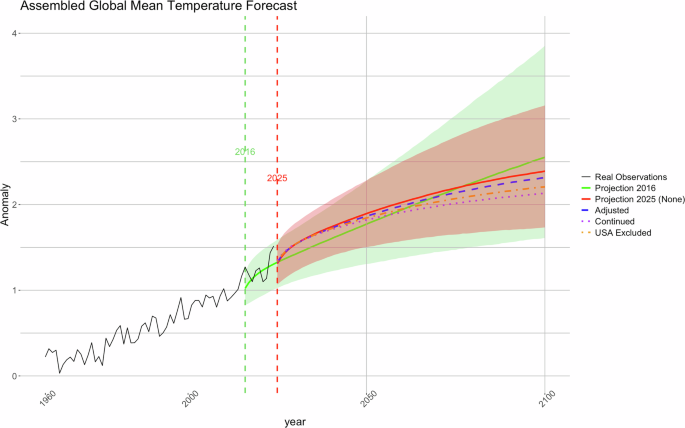
Probabilistic forecasts of global mean temperature increase by 2100: based on pre-Paris data up to 2015 (median in green line and very likely range in green shaded area); based on current data up 2024 (red line and pink shaded area); based on the assumption that all countries make their 2015 initial Nationally Defined Contributions (NDC-1s) and then revert to previous patterns after the date of the NDC-1s, which is 2030 in most cases (Adjusted: dashed blue); based on the assumption that all countries meet their NDC-1s and continue to improve at the same rate thereafter (Continued: dotted purple); and based on the Continued assumption, but without the USA meeting its NDC-1 (USA Excluded: orange dashed-dotted line).
However, strikingly, in projections conditional on current emission trajectories, uncertainty about future climate change has gone down substantially, with the width of the very likely range going down by 36%. Most of this reflects the reduction of the upper bound by 0.7 °C from 3.9 °C to 3.2 °C. The risk of the most catastrophic climate change, over 3 °C, has thus gone down markedly, from 26% to 9%, thanks to the declines in carbon intensity since 2015. The probability of less than 2 °C warming by 2100, which was 18% based on data to 2015, has barely changed, to 17% based on data to 2024.
Figure 7 also shows the median projected temperature change under several scenarios, to be compared with the projected increase of 2.4 °C under current trends, as of 2024. If all countries meet their NDC-1s, which are mostly for 2030, and revert to current trends from 2030 to 2100 (the “Adjusted” scenario), the median projected temperature increase would be slightly smaller, at 2.3 °C, and the probability of staying under 2 °C would increase slightly from 17% to 20%. If all countries meet their NDC-1s for 2030 and then continue to improve at the same rate from 2030 to 2100 (the “Continued” scenario), the projected increase would be 2.1 °C, and the probability of staying under 2 °C would increase further, to 34%. This is still less than 50%, however, and underscores the fact that the NDC-1s are not ambitious enough to meet the Paris Agreement goal of staying under 2 °C, even if they are continued past 2030. In both scenarios, we adjust countries’ future emissions by modifying their projected carbon intensity and GDP trajectories to match their stated NDC targets8
In January 2025, following the inauguration of President Donald Trump, the USA gave notice of its intention to withdraw from the Paris Agreement, a withdrawal that will become effective in January 2026. Accordingly, we considered the scenario under which the USA does not continue the efforts promised under its NDC-1 after its NDC-1 due date of 2025 (the “USA excluded” scenario), instead continuing on its current trend. The projected temperature increase would go up from 2.1 °C to 2.2 °C, and the probability of staying under 2 °C would from go down from 34% to 27%. Note that this might be an optimistic assessment. It seems possible that the worst-case scenario is not that the US will simply discontinue its post-Paris efforts, but rather that the trend might flip.
Probability of countries meeting their NDCs
Figure 8 shows the probability, based on data to 2024, that each country will keep its CO2 emissions under its NDC-1. We calculate these probabilities by comparing the 2030 emission targets stated in NDC-1 against our posterior distribution of projected emissions in 2030. Compared to the previous probabilistic projection, major economies like Germany (97%), Japan (50%), and France (36%) have improved substantially. China has been performing better than before, with the probability of its meeting its NDC-1 increasing from 18% to 26% now. The probability for the USA is very low at 1%, but this reflects the fact that the NDC-1 for the USA is for 2025, only one year from the last data point. The USA will come close to meeting its NDC-1, but is unlikely to completely attain it.
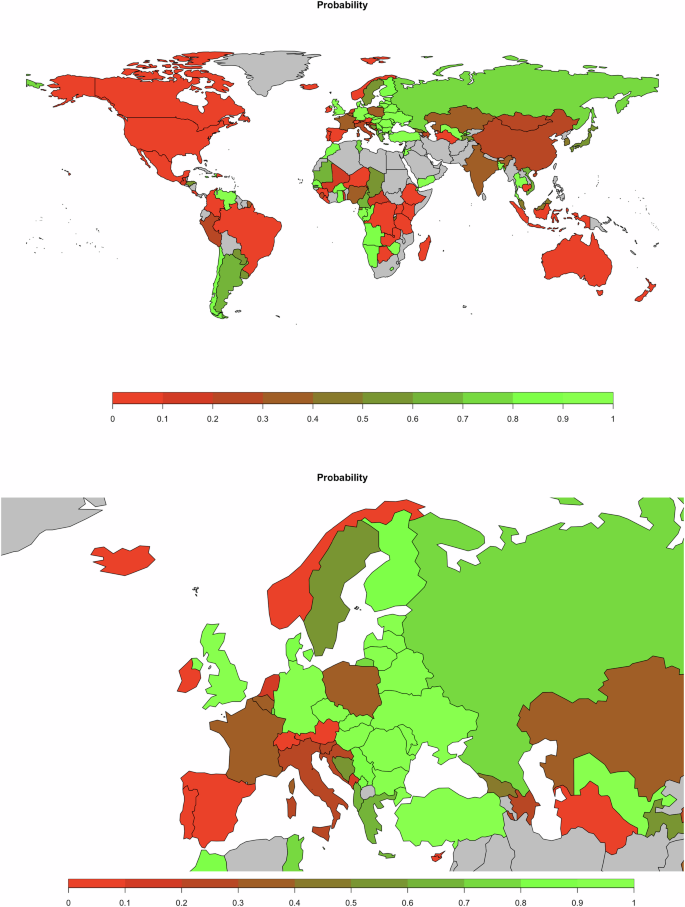
Top: World; Bottom: Europe (zoomed in).
The Paris Agreement requires countries to update their NDCs every five years. Due to the significant gap between the emissions reductions needed to limit global warming to 1.5 °C and the current plans, the Glasgow Climate Pact32, agreed upon in November 2021, urged all nations to revisit and strengthen their NDC targets by 2022. Each new round of updates is expected to increase ambition with deeper emissions cuts and broader adaptation measures. We call these second-round updated NDCs the NDC-2s. Under the NDC-2s, most countries have raised their carbon reduction targets by 10% to 25% compared to their NDC-1. Given that our new projection starts in 2025, we further consider assessments about countries meeting their targets based on the NDC-2s. We similarly assess the probability of countries meeting their updated NDC-2 targets, which are generally more ambitious and thus harder to achieve. The resulting probabilities are much lower: China(8%), USA(0%), Germany(22%), India(0%), Japan(0%), Russia(61%) and UK(21%).
Recall that, on current trends, without additional efforts, the median predicted global temperature increase by 2100 is 2.4 °C. Under NDC-2, if all countries meet their NDCs but then revert to current trends, the increase is somewhat lower at 2.2 °C. If countries continue their emissions reduction efforts after meeting their NDC-2s, the temperature increase would be projected to drop to 2.0 °C. In the scenario where the USA does not meet its NDC, the forecasted increase is 2.1 °C. With the NDC-2s, the probability of staying below 2 °C is 17% under the “None” scenario, 26% under the “Adjusted” scenario, 53% under the “Continued” scenario, and 41% under the “USA Excluded” scenario. In 2024, the global average temperature reached 1.5 °C for the first time, so the chance of staying below 1.5 °C is now very low under all scenarios, and we do not discuss it further here.
Additional efforts needed to stay under 2 °C
Our median projection for cumulative carbon emissions by 2100, starting from 2025, under the “Continued” scenario is 1366 Gt CO2. To reach this total by the end of the century, annual global emissions would need to decrease at a constant annual rate of 2.2%. For an 80% chance of keeping global warming below 2 °C, cumulative emissions would need to be capped at 845 Gt CO2 in 2100, necessitating a substantially higher annual decline rate of 4.2%. We now assess how much the emissions reductions pledged in the NDCs would need to be increased to achieve the target. We focus on two scenarios: “Likely 2 °C” (a 66% probability of staying below 2 °C), and “Very likely 2 °C” (a 90% probability of staying below 2 °C). The required increase in the NDCs varies by country, depending on their pledges and progress to date. For the largest emitters, the necessary increases in reductions over the NDC-1s are projected to be 13% for China, 14% for the USA, 36% for Germany, 19% for India and 6% for Japan (see the NDC-1 columns in Table 1 for more details).
In terms of the required increases in the NDC-2 target (see the NDC-2 columns in Table 1), significant progress has been observed for most countries over the period 2015-2024. For the top six economies by GDP and the top five emitters (excluding Iran), the additional efforts needed to achieve the “Likely 2 °C” and “Very likely 2 °C” goals have generally decreased. However, Japan stands out as an exception. Transitioning from NDC-1 (a 26% reduction in emissions relative to 2013 levels by 2030) to NDC-2 (a 46% reduction by 2030) represents a 77% increase in ambition. This is an extremely challenging commitment given Japan’s current emissions trajectory. From 2025 to 2030, Japan would need to increase its annual emissions reduction rate by a factor of 10. While the required rates of decline for achieving “Very likely 2 °C” have decreased—from 2.2 to 1.4 times higher when comparing NDC-1 to NDC-2—the magnitude of effort Japan must undertake remains higher than before. Achieving these targets would demand even greater ambition and action under its NDC-2 commitments.
Discussion
We have updated the Bayesian probabilistic climate change projection method of Liu and Raftery8 to include the post-Paris nine years of data, to use more current estimates of climate sensitivity, and to update previous data. The underlying model has turned out to be well-calibrated when assessed using the more recent data.
In the nine years after the adoption of the Paris Agreement, carbon intensity worldwide declined by 25%, an annual rate of 3.1%, compared with the previously projected rate of 2.4% and the target rate of 4.1% implied by the NDC-1s. While falling short of the NDC-1s, this is a substantial improvement over the pre-Paris period, when the annual rate of improvement was 1.1%. As a result, on current trends, annual emissions are now projected to decline by 64% in 2100 relative to 2024, much faster than the previously projected decline of 10%. This also implies that if the more ambitious NDC-2 commitments are met, and progress continues at the same rate until 2100, the chance of staying under 2 °C of warming by 2100 is 53%. On current trends, the chance of the most catastrophic warming, over 3 °C, has gone down from 26% based on data to 2015, to 9%. Uncertainty about future temperature change has gone down dramatically, by 75%.
In spite of these positive developments, the overall news is not good. In 2015–2024, total CO2 emissions actually increased by 5.6%, an annual rate of 0.6%. This is because world GDP increased faster than carbon intensity decreased, more than canceling out the progress made. On current trends, the projected increase in global average temperature by 2100, previously 2.6 °C, has gone down only modestly to 2.4 °C, while the chance of staying under 2 °C, has barely changed, at 17%. The chance of countries meeting their NDC-1s remains low, but if they do and efforts continue, the projected temperature increase would be 2.1 °C, and the chance of staying under 2 °C would be 34%.
Carbon intensity varies greatly around the world, with China and the USA having intensities that are three and one and a half times greater than that of Germany, respectively. This suggests that there is a big scope for higher-emissions countries to reduce their emissions greatly and rapidly, possibly by adopting some of the approaches in use in Germany and some of the other lower-emissions European countries.
There are several potential limitations to our approach. We do not explicitly model climate feedback to the drivers of greenhouse emissions. However, the model does incorporate correlations between GDP per capita and carbon emissions, thus allowing for such feedback. We found no evidence of feedback from climate to population.
Also, we do not explicitly model non-CO2 greenhouse gas emissions. However, previous research has found that temperature increase by 2100 is largely a linear function of cumulative carbon dioxide emissions3,33, so that explicitly including other greenhouse gases would not substantially change the projections. Specifically, cumulative fossil fuel CO2 emissions account for over 90% of the variance in projected global mean temperature across climate models8. Our underlying statistical model is a linear regression model, in which non-CO2 greenhouse gas emissions contribute to the stochastic error term. The uncertainty in our probabilistic forecasts can thus be viewed as partly due to uncertainty about future non-CO2 greenhouse gas emissions. However, this uncertainty is small relative to uncertainty about future CO2 emissions because the latter account for much more of the overall uncertainty in the forecasts.
Thus, incorporating non-CO2 greenhouse gases into the model would be unlikely to change the results substantially or make the forecasts much more accurate or better calibrated, but it could make the modeling exercise more complicated and harder to interpret and communicate. Nevertheless, if highly reliable forecasts of future non-CO2 emissions and assessments of their effects on future climate change could be developed, it would be worth including them. It should be noted that not including non-CO2 greenhouse gases does not imply that they do not have an important effect on climate change, but merely that including them would not greatly change the probabilistic forecasts. Indeed, there is evidence that non-CO2 greenhouse gases do have an impact on climate change34,35,36,37. Thus, a limitation of our approach is that it would not yield policy advice about non-CO2 emissions.
Methods
Data
We used annual datasets spanning from 1960 to 2024 for 157 countries, accounting for over 99% of the global population. Population data were collected from the World Population Prospects 20247, updated to 2023. Predictions for the year 2024 are based on historical growth trends from 2022 to 2023, since population tends to change smoothly. Using the same model used by the United Nations for its probabilistic projections, we produced country-specific probabilistic forecasts for all countries.
GDP per capita (GDPpc) data are adjusted to reflect equal purchasing power parity (PPP) in 2011 US dollars, and are derived from the 2023 version of the Maddison Project38, with updates extending to 2022. For the following years, data are supplemented from the World Economic Outlook (October 2024)39, applying a multiplicative adjustment calculated as the ratio of Maddison GDPpc to IMF GDPpc in 2022 for each country. This approach helped us update the data to 2024.
CO2 emissions were obtained from the Global Carbon Budget 202431, which provides updates through 2023. According to the report, in 2024, CO2 emissions were expected to increase by 0.2% in China, 4.6% in India, and 0.4% in the rest of the world, while declining by 0.6% in the United States, and 3.8% in the European Union (EU27, excluding the UK).
The observed temperature data were from the HadCRUT.5.0.2.0 analysis dataset40, which has been updated to include records through 2024.
Estimating climate sensitivity by the TCRE
Liu and Raftery8 estimated climate sensitivity using an ensemble of climate models from CMIP5. Instead, here we represent the relationship between CO2 emissions and temperature through the Transient Climate Response to Cumulative CO2 Emissions (TCRE), defined as the change in global average surface temperature change per unit of CO2 emitted41. Since TCRE is generally derived from climate model outputs and is independent of CO2 emission rates and remains relatively constant over time42, it is a stable and reliable metric that combines the results of various climate models. More importantly, the TCRE value reported in the latest IPCC AR6 report accounts for and reduces the influence of certain extreme models in CMIP6, resulting in a lower estimate of climate sensitivity compared to the CMIP5 ensemble. The AR6 represents uncertainty about the TCRE (° C/1000 GtCO2) using a Gaussian distribution with mean 0.45 and standard deviation 0.181 (p. 749).
Temperature forecasting model
The model is built in the following two main steps. First, we make projections of the three components of the IPAT identity based on Bayesian hierarchical models, and we then get the CO2 emissions forecast by multiplying them together. We obtain the population projection from the UN’s official World Population Prospects 2024 version, which uses Bayesian hierarchical models for fertility, mortality, and migration. Projections for GDP per capita and carbon intensity follow the methodology outlined in ref. 5. For GDP per capita, the model assumes the existence of a global economic frontier, represented by the United States, which follows a random walk with drift on the logarithmic scale. The GDP per capita of other countries is assumed to converge stochastically toward this frontier at country-specific rates. Meanwhile, the logarithm of carbon intensity is modeled as a linear trend plus a first-order autoregressive (AR(1)) process for each country. These hierarchical models allow each country to have its own set of parameters drawn from a shared global distribution, borrowing strength across countries. This framework helps most for nations with sparse or noisy data, as it provides more stable and reliable projections while preserving country-specific dynamics.
The model’s performance was assessed through out-of-sample predictive validation, which showed it to be reasonably well calibrated for probabilistic forecasting of population, GDP, carbon intensity, and emissions both at national and aggregated scales5. The more recent data confirm that the model is well calibrated.
Second, we make temperature predictions based on a linear model.
$${x}_{t}=\alpha +\beta {c}_{t}+{\epsilon }_{t},$$
in which ct and xt are cumulative carbon emission and global temperature anomaly in year t for t = 2025, …, 2100, respectively. The quantity ϵt is an error term that captures the residual variation in temperature anomalies, including model uncertainty, measurement errors, and other unobserved influences on temperature dynamics. The parameter β is an overall climate sensitivity, and here we use the TCRE (following \(N{\left(0.45,0.1{8}^{2}\right)}^{\circ }\)C for per 1000 Gt CO2). The parameter α is the intercept.
We used a Markov Chain Monte Carlo (MCMC) sampling algorithm on the models for population, GDP per capita, and carbon intensity. For population, we used the Bayesian hierarchical models used by the UN, while for GDP per capita and carbon intensity we used the ‘rjags’ package in R. The analysis was conducted using five separate chains, each running for a total of 100,000 iterations following an initial burn-in period of 5,000 iterations. To reduce autocorrelation, we applied thinning by retaining only every 20th sample. To generate probabilistic forecasts of CO2 emissions for each country, we drew samples from the future population distributions and jointly sampled from the joint posterior distribution of GDPpc and carbon intensity for all future years and countries. These sampled values were then multiplied to create posterior trajectories for CO2 emissions. This entire process was repeated 1000 times, resulting in 1000 sets of posterior CO2 emissions samples. For the temperature prediction, we used 1000 samples of cumulative CO2 emissions for each year and obtained corresponding temperature samples based on the linear model.
Required increase in the NDCs to meet the climate target
To achieve a climate target with a given probability requires keeping cumulative CO2 from year 2025 to year T to at most C Gt CO2. We define an annual global decline rate a to achieve this. Suppose that in 2024 the annual emission is E0. Then in 2024 + t, the annual emissions are Et = E0e−ta.
Thus, cumulative global emissions from year 2024 to year T are
$$\int_{0}^{T-2024}{E}_{0}{e}^{-ta}\,dt={E}_{0}\left(\frac{1-{e}^{-(T-2024)a}}{a}\right)=C.$$
(1)
Let ac represent the annual decline rate necessary to fulfill the NDCs of the Paris Agreement. This rate is determined as the solution to (1), where C denotes the cumulative emissions by time T under the “Continued” scenario. Let ap be the annual decline rate to reach the climate goal G°C at year T with probability p. Based on historical data and the country’s NDC goal, we can estimate the annual decline rate as from the period 2025–2030, and obtain the actual annual emission Y at 2024.
Given a climate target G°C by year T, with a probability p, we can express this goal as
$$P({x}_{T}\le G)=p,$$
(2)
$$P(\beta \times {c}_{T}+\alpha \le G)=p.$$
(3)
Let βq be the q quantile of β where P(β≤βq) = q. Given α = x2024 − βc2024, the maximum cumulative emissions are
$${C}_{T}=\frac{G-{x}_{2024}}{{\beta }_{p}}+{c}_{2024}.$$
(4)
Then, for a given country, the required emissions to meet the climate target G° C at time T would be \(Y\times {(1-\frac{{a}_{p}}{{a}_{c}}\cdot {a}_{s})}^{2030-2024}\), where ap is the solution of \({E}_{0}\left(\frac{1-{e}^{-(T-2024)a}}{a}\right)={C}_{T}\). In our case, T = 2100 and G = 2.
While countries’ NDCs take various forms—including absolute emissions reductions, reductions in emissions intensity, or reductions relative to business-as-usual (BAU) scenarios—we standardize all targets into implied reductions in fossil fuel and industry CO2 emissions. We focus on these emissions because they are more consistently reported across countries, the IPCC AR6 highlights a near-linear relationship between cumulative CO2 and global temperature change, and prior research has shown that fossil fuel CO2 emissions alone account for over 95% of the variance in projected global temperature increases1,8. For countries with absolute targets (e.g., the USA), the NDC is treated as a commitment to a specific emissions level by 2030. For those with intensity-based targets (e.g., China), we calculate the carbon intensity by dividing annual emissions by the corresponding year’s GDP from the World Bank. For BAU-based targets, we compute the promised reduction relative to the projected BAU level and apply this proportion to our probabilistic forecast. In all cases, the implied NDC target is used to derive the annual decline rate ac, which is then compared with the rate ap required to meet a specific climate goal.
Data availability
Data needed to replicate this analysis are available at the GitHub repository https://github.com/jitongj/Climate.
Code availability
Code to replicate this analysis is available at the GitHub repository https://github.com/jitongj/Climate.
References
Chen, D. et al. Framing, Context, and Methods. In Climate Change 2021: The Physical Science Basis. Contribution of Working Group I to the Sixth Assessment Report of the Intergovernmental Panel on Climate Change (eds Masson-Delmotte, V. et al.) 147–286 (Cambridge University Press, Cambridge, United Kingdom and New York, NY, USA, 2021).
van Vuuren, D. P. et al. The representative concentration pathways: an overview. Clim. Change 109, 5–31 (2011).
Intergovernmental Panel on Climate Change. Climate Change 2013: The Physical Science Basis (WMO/UNEP, Geneva, Switzerland, 2014). Working Group I Contribution to the Fifth Assessment Report of the Intergovernmental Panel on Climate Change.
Meinshausen, M. et al. The shared socio-economic pathway (SSP) greenhouse gas concentrations and their extensions to 2500. Geosci. Model Dev. 13, 3571–3605 (2020).
Raftery, A. E., Zimmer, A., Frierson, D. M. W., Startz, R. & Liu, P. Less than 2 °C warming by 2100 unlikely. Nat. Clim. Change 7, 637–641 (2017).
Raftery, A. E., Alkema, L. & Gerland, P. Bayesian population projections for the United Nations. Stat. Sci. 29, 58–68 (2014).
United Nations, Department of Economic and Social Affairs, Population Division (2024). World population prospects 2024. Online Edition.
Liu, P. R. & Raftery, A. E. Country-based rate of emissions reductions should increase by 80% beyond nationally determined contributions to meet the 2 °C target. Commun. Earth Environ. 2, 29 (2021).
Chen, X., Raftery, A. E., Battisti, D. S. & Liu, P. R. Long-term probabilistic temperature projections for all locations. Clim. Dyn. 60, 2303–2314 (2023).
Vargas Zeppetello, L. R., Raftery, A. E. & Battisti, D. S. Probabilistic projections of increased heat stress driven by climate change. Commun. Earth Environ. 3, 183 (2022).
Rennert, K. et al. Comprehensive evidence implies a higher social cost of CO2. Nature 610, 687–692 (2022).
Rennert, K. et al. The social cost of carbon: advances in long-term probabilistic projections of population, gdp, emissions, and discount rates. Brook. Pap. Econ. Act. 2021, 223–305 (2022).
Tudor, C. & Sova, R. Benchmarking GHG emissions forecasting models for global climate policy. Electronics 10, 3149 (2021).
Huard, D., Fyke, J. G., Capellán-Pérez, I., Matthews, H. D. & Partanen, A.-I. Estimating the likelihood of GHG concentration scenarios from probabilistic IAM simulations. Authorea Preprints (2022).
Jin, I. Probability of achieving NDC and implications for climate policy: CO-STIRPAT Approach. J. Econ. Anal. 2, 82–97 (2023).
Jin, I. Emission prediction, global stocktake, and NDC update: Co-stirpat dynamic system. Green Low-Carbon Econ. 3, https://doi.org/10.47852/bonviewGLCE42022058 (2024).
Yuan, R., Rodrigues, J. F., Tukker, A. & Behrens, P. The statistical projection of global GHG emissions from a consumption perspective. Sustain. Prod. Consum. 34, 318–329 (2022).
Srikrishnan, V., Guan, Y., Tol, R. S. & Keller, K. Probabilistic projections of baseline twenty-first century CO2 emissions using a simple calibrated integrated assessment model. Clim. Change 170, 37 (2022).
Hausfather, Z. & Moore, F. C. Net-zero commitments could limit warming to below 2 °C. Nature 604, 247–248 (2022).
Meinshausen, M. et al. Realization of Paris Agreement pledges may limit warming just below 2 °C. Nature 604, 304–309 (2022).
Tanaka, K., Tibrewal, K., Ciais, P. & Boucher, O. Transparent framework to assess the revision of national climate pledges. Preprint (Version 1), Research Square Available at https://doi.org/10.21203/rs.3.rs-3889145/v1 (2024).
Pielke, R. J., Burgess, M. G. & Ritchie, J. Most plausible 2005–2040 emissions scenarios project less than 2.5 degrees C of warming by 2100. https://doi.org/10.31235/osf.io/m4fdu (2021).
Pielke, R. J., Burgess, M. G. & Ritchie, J. Plausible 2005-2050 emissions scenarios project between 2 and 3 degrees C of warming by 2100. Environ. Res. Lett. 17, 024027 (2022).
Climate Action Tracker. 2100 warming projections. climate action tracker https://climateactiontracker.org/global/temperatures Accessed: 2022-03-01 (2022).
Lee, J.-Y. et al. Future global climate: Scenario-based projections and near-term information. In Masson-Delmotte, V. et al. (eds.) Climate Change 2021: The Physical Science Basis. Contribution of Working Group I to the Sixth Assessment Report of the Intergovernmental Panel on Climate Change, 553–672 (Cambridge University Press, Cambridge, United Kingdom and New York, NY, USA, 2021).
Ehrlich, P. R. & Holden, J. P. Impact of population growth. Science 171, 1212–1217 (1971).
Kaya, O. Impacts of Carbon Dioxide Emissions on GWP: Interpretation of Proposed Scenarios (IPCC/Response Strategies Working Group, 1989).
Levin, K., Cashore, B., Bernstein, S. & Auld, G. Overcoming the tragedy of super wicked problems: constraining our future selves to ameliorate global climate change. Policy Sci. 45, 123–152 (2012).
IPCC. Summary for policymakers. In Climate Change 2023: Synthesis Report. Contribution of Working Groups I, II and III to the Sixth Assessment Report of the Intergovernmental Panel on Climate Change (eds Team, C. W., Lee, H. & Romero, J.) Vol. 20 (IPCC, Geneva, Switzerland, 2023).
Fyson, C. et al. When will global greenhouse gas emissions peak? Tech. Rep. https://climateanalytics.org/publications/when-will-global-greenhouse-gas-emissions-peak (2023).
Friedlingstein, P. et al. Global carbon budget 2024. Earth System Science Data Discussions [preprint] https://doi.org/10.5194/essd-2024-519 In review (2024).
Lennan, M. & Morgera, E. The Glasgow climate conference (COP26). Int. J. Mar. Coast. Law 37, 137–151 (2022).
Allen, M. R. et al. Warming caused by cumulative carbon emissions towards the trillionth tonne. Nature 458, 1163–1166 (2009).
Fuglestvedt, J. et al. Implications of possible interpretations of ‘greenhouse gas balance’ in the Paris agreement. Philos. Trans. R. Soc. A: Math. Phys. Eng. Sci. 376, 20160445 (2018).
Tanaka, K. & O’Neill, B. C. The Paris agreement zero-emissions goal is not always consistent with the 1.5 °C and 2 °C temperature targets. Nat. Clim. Change 8, 319–324 (2018).
Sun, T., Ocko, I. B., Sturcken, E. & Hamburg, S. P. Path to net zero is critical to climate outcome. Sci. Rep. 11, 22173 (2021).
Van Soest, H. L., den Elzen, M. G. & van Vuuren, D. P. Net-zero emission targets for major emitting countries consistent with the Paris agreement. Nat. Commun. 12, 2140 (2021).
Bolt, J. & Van Zanden, J. L. Maddison-style estimates of the evolution of the world economy: A new 2023 update. J. Econ. Surv. 1–41 https://doi.org/10.1111/joes.12618 (2020).
International Monetary Fund. World Economic Outlook. Steady but Slow: Resilience Amid Divergence https://www.imf.org/en/Publications/WEO/Issues/2024/04/16/world-economic-outlook-april-2024 (2024).
Morice, C. P. et al. An updated assessment of near-surface temperature change from 1850: the HadCRUT5 data set. J. Geophys. Res.: Atmos. 126, e2019JD032361 (2021).
MacDougall, A. H. The transient response to cumulative CO2 emissions: a review. Curr. Clim. Change Rep. 2, 39–47 (2016).
MacDougall, A. H. & Friedlingstein, P. The origin and limits of the near proportionality between climate warming and cumulative CO2 emissions. J. Clim. 28, 4217–4230 (2015).
Acknowledgements
This work was supported by NIH grant R01 HD070936. We thank Peiran Liu, Kyle Armor and David Battisti for discussions, and the editor and two anonymous reviewers for helpful comments.
Ethics declarations
Competing interests
The authors declare no competing interests.
Peer review
Peer review information
Communications Earth & Environment thanks Vivek Srikrishnan and the other anonymous reviewer(s) for their contribution to the peer review of this work. Primary Handling Editors: Joe Aslin and Aliénor Lavergne. [A peer review file is available].
Additional information
Publisher’s note Springer Nature remains neutral with regard to jurisdictional claims in published maps and institutional affiliations.
Supplementary information
Rights and permissions
Open Access This article is licensed under a Creative Commons Attribution-NonCommercial-NoDerivatives 4.0 International License, which permits any non-commercial use, sharing, distribution and reproduction in any medium or format, as long as you give appropriate credit to the original author(s) and the source, provide a link to the Creative Commons licence, and indicate if you modified the licensed material. You do not have permission under this licence to share adapted material derived from this article or parts of it. The images or other third party material in this article are included in the article’s Creative Commons licence, unless indicated otherwise in a credit line to the material. If material is not included in the article’s Creative Commons licence and your intended use is not permitted by statutory regulation or exceeds the permitted use, you will need to obtain permission directly from the copyright holder. To view a copy of this licence, visit http://creativecommons.org/licenses/by-nc-nd/4.0/.
About this article
Cite this article
Jiang, J., Shi, S. & Raftery, A.E. Mitigation efforts to reduce carbon dioxide emissions and meet the Paris Agreement have been offset by economic growth. Commun Earth Environ 6, 823 (2025). https://doi.org/10.1038/s43247-025-02743-x
Received: 22 April 2025
Accepted: 22 August 2025
Published: 17 October 2025
Version of record: 17 October 2025
DOI: https://doi.org/10.1038/s43247-025-02743-x