.png)


SwiftUI is like magic.
But, like all well-designed magic systems, it comes with a cost.
What, you thought that beautiful declarative syntax and automatic data bindings come free? Think again.
Swift’s pesky memory safety mechanisms put it at a performance disadvantage compared to unsafe languages like C and C++. In the same way, SwiftUI’s beautiful reactive data-flow gobbles CPU cycles like an Ozempic patient at the hot-dog eating contest.
To achieve the maximum 120Hz refresh rate, the main thread has to execute all layout computation and rendering in 8.3ms to avoid a frame drop: the dreaded hitch. With system overhead, you’re lucky to get 5ms for this work.
SwiftUI can run into very painful performance problems when dealing with infinite scrolling feeds. Today, we will investigate these performance problems, understand why they happen, and explore techniques to mitigate them, making your SwiftUI performance buttery smooth 🧈.
Subscribe to Jacob’s Tech Tavern for free to get ludicrously in-depth articles on iOS, Swift, tech, & indie projects in your inbox every week.
Full subscribers to Jacob’s Tech Tavern unlock Quick Hacks, my advanced tips series, and enjoy my long-form articles 3 weeks before anyone else.
Still unsure? How about 2 week test-drive?
We’re going to focus on scroll views, the most popular punching-bag of SwiftUI detractors. Let’s try out some approaches to get an infinitely-scrolling view that runs at a cool 120fps.
We have a simple SwiftUI feed, with many identical cells containing a couple of photos (courtesy of Lorem Picsum), text, a spinner animation, and a cool gradient effect underneath the user’s name and profile pic.

I’m a scientist at heart. To ensure a fair test, I am running all of these profiles on my iPhone 15 Pro, running iOS 18.3.2.
Since the system decides when to run at 120fps vs the regular 60, I couldn’t consistently get CADisplayLink to call back at 120Hz. Therefore, we are really going to do the 60fps challenge.
To apologise for this deception, I’ll make it harder for myself and perform all the testing on Low Power Mode, where the system is throttled. At my startup, this is one of our favourite techniques to test our app for high performance: if your screen scrolls smoothly on Low Power Mode, you’re golden.
There are several ways we might structure the scrolling feed. Our first port of call might be a VStack.
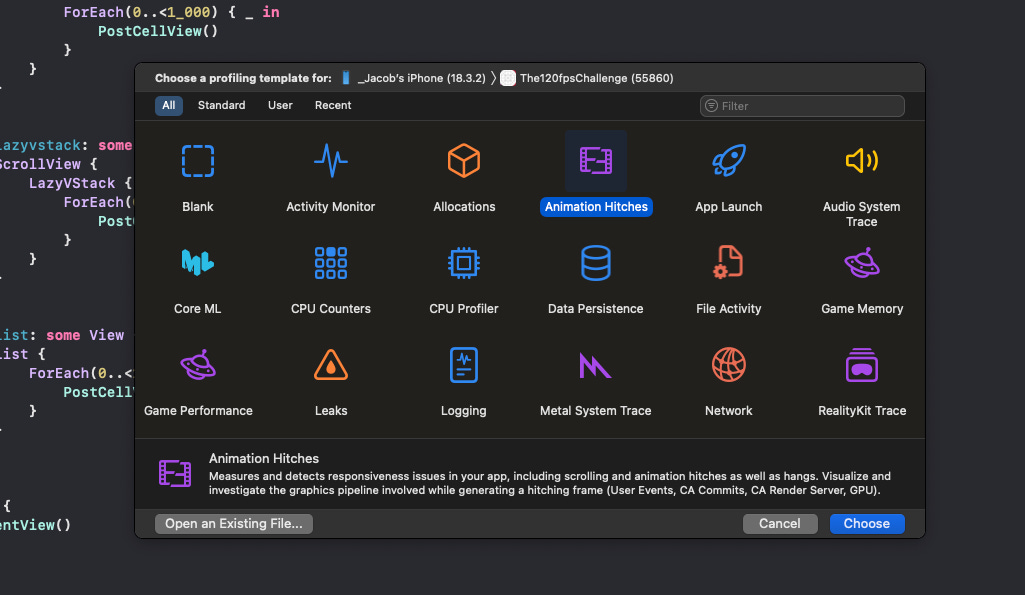
If this isn’t your first rodeo, you might predict what happens when we profile it with the Animation Hitches instrument.
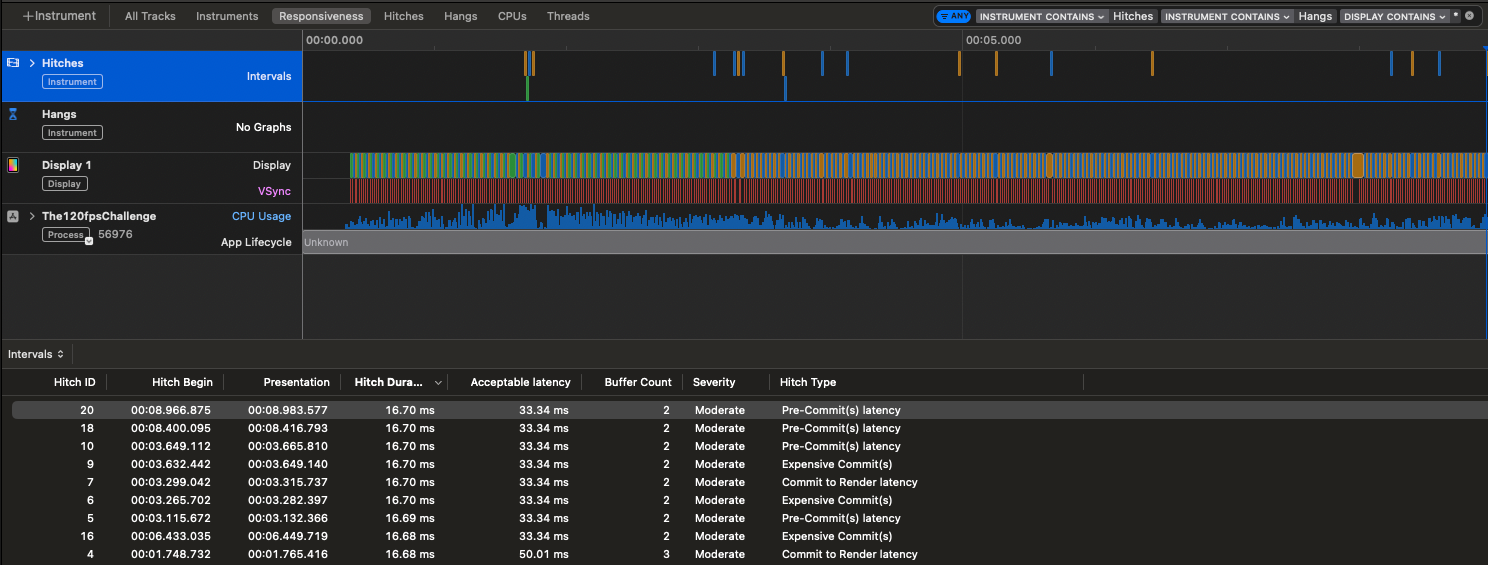
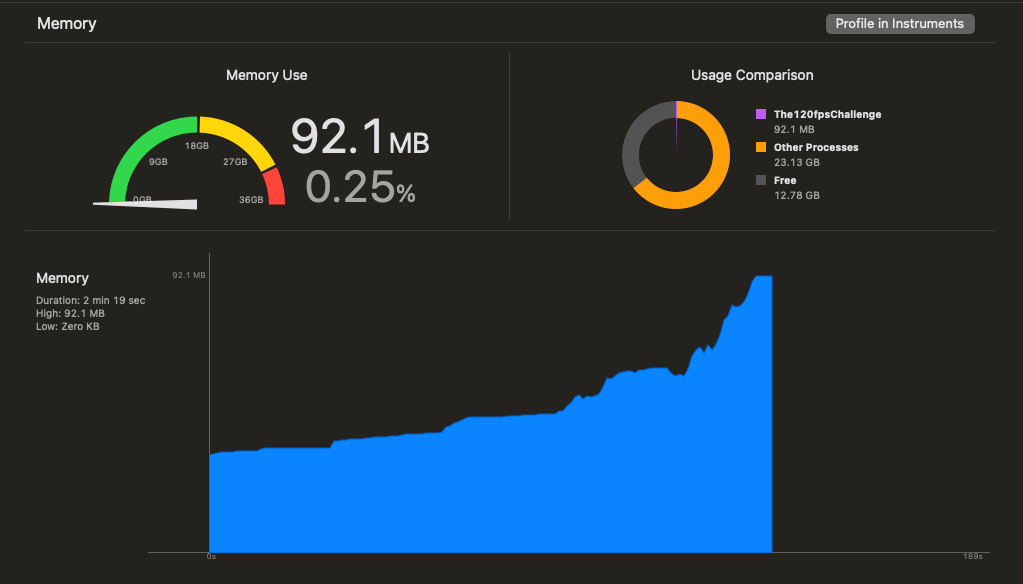
The screen immediately froze up when I loaded into the app. This huge initial hang is because VStacks load and render the entire view hierarchy when they display. This meant all 1,000 cells were being loaded and laid out simultaneously.
Touching the screen did nothing. All interaction was blocked.
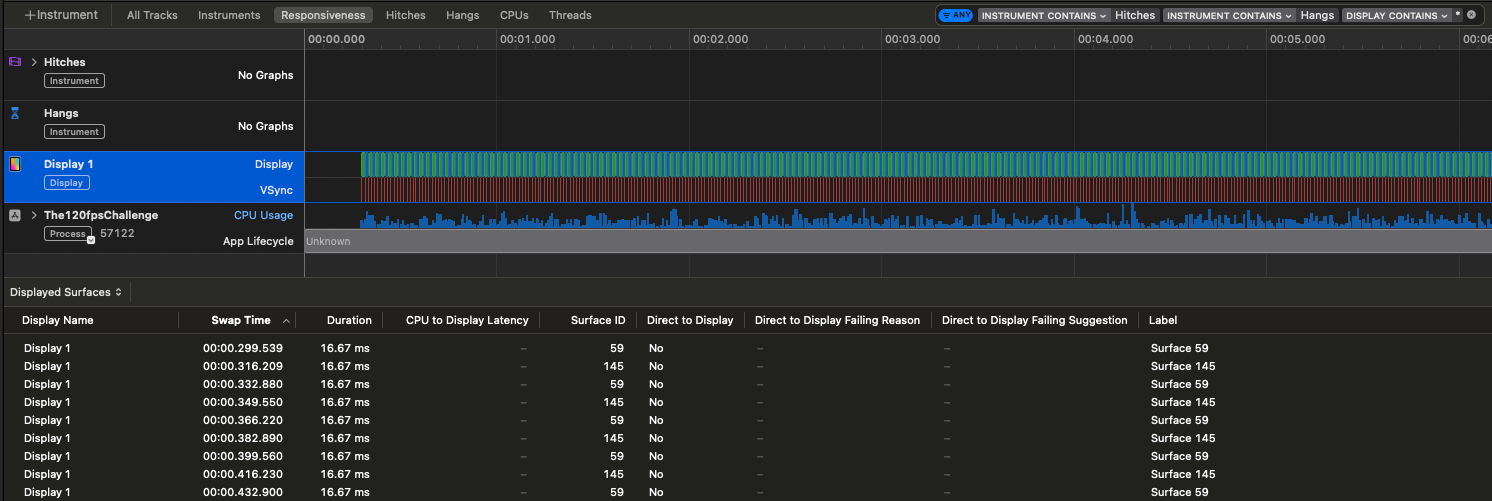
Once it had finished loading, I could now interact with the scroll view, but experienced frame drops galore.
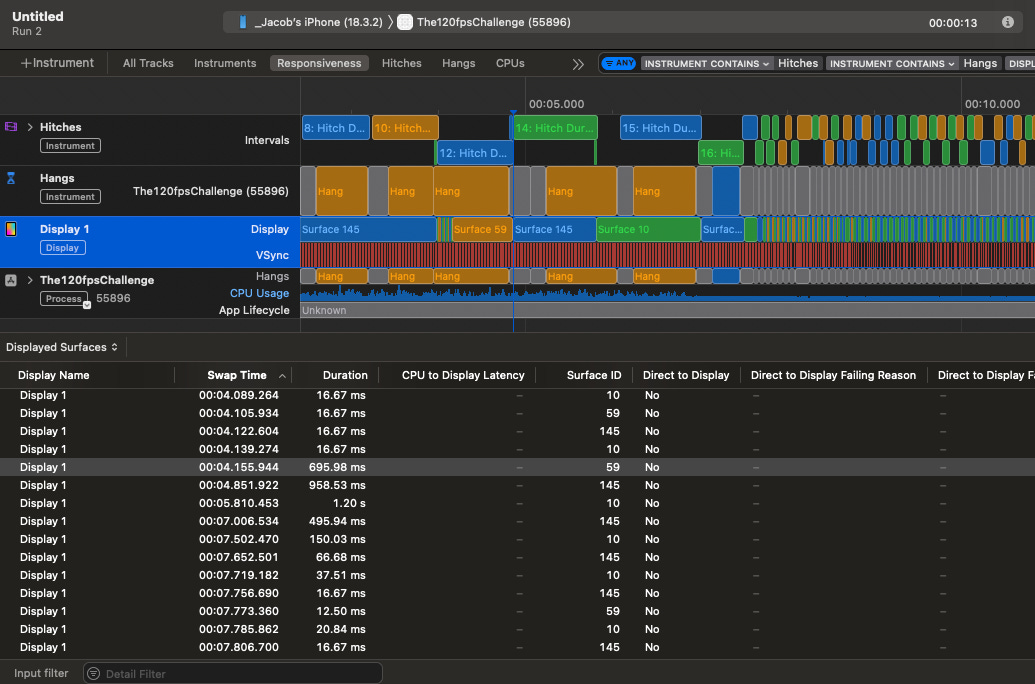
As you can see through the VSync trace, while some frames rendered in the expected 16.67ms (60fps), many took far longer, which manifested as many dropped frames per second.
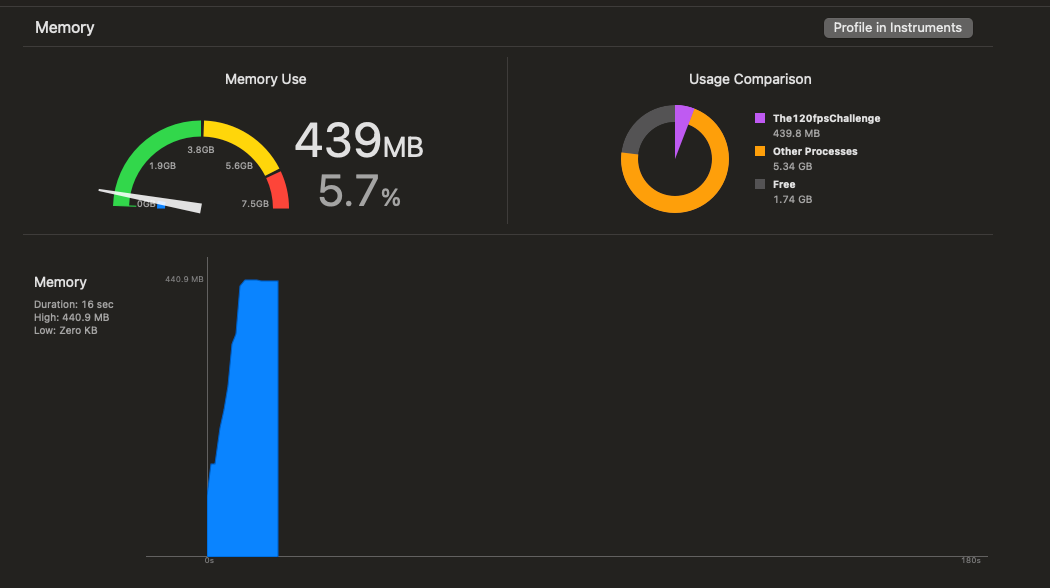
Eagerly loading 1,000 views all at once also created a massive memory spike accompanying the hang, which never went away since the views were all held in memory.
Clearly, VStack isn’t the way to go with scrolling feeds.
Let’s upgrade to the next approach—the one recommended by Apple for scrollable feeds—the LazyVStack.
Lazy stacks load and render their subviews on-demand, as they scroll close to the viewport (the visible on-screen portion of your layout).
Because these sizing and layout computations are performed on-demand, we are trading off some accuracy to get this performance. LazyVStack dynamically estimates geometry based on the number of views.
What does this mean practically? Let’s imagine your views are all dynamically sized, or your layout contains cells with varying heights. If you programmatically scroll to a specific cell way off-screen, SwiftUI suddenly has to run all this layout computation, causing a big performance hit*.
*We will see how this can go wrong in a moment.
The Instruments trace on loading and scrolling is much more healthy. You can see in the trace that VSync comfortably pushes each frame at the required 16.67ms interval for 60fps, even on Low Power Mode.
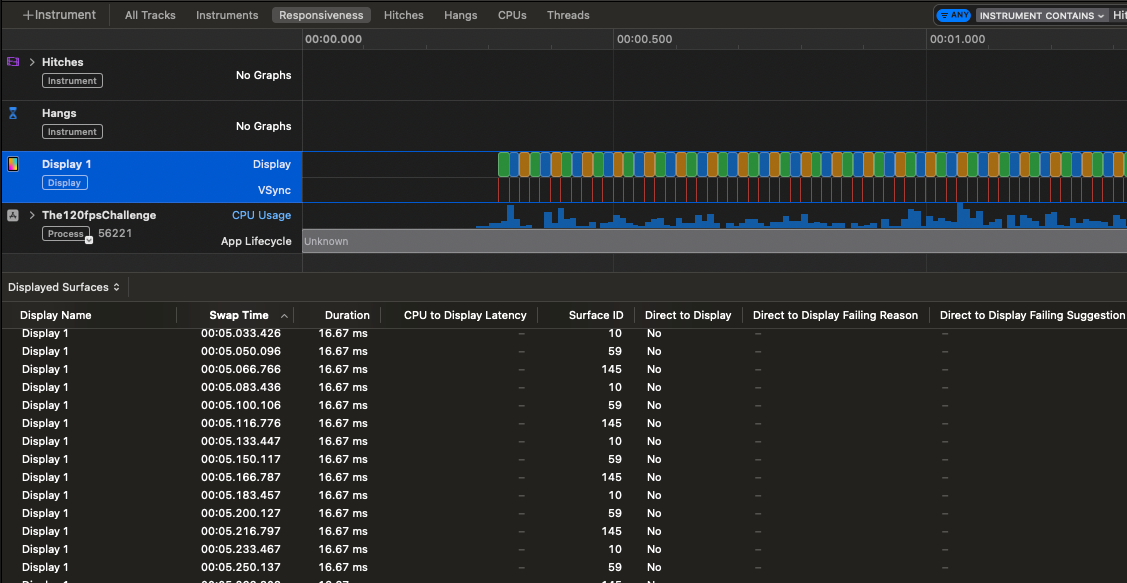
Scrolling down through hundreds of items, we get a few very minor frame drops but no hangs. From the point of View of SwiftUI, only a few items are on-screen at once, so it can all be comfortably computed and rendered in the milliseconds between each frame.
This is a great base case, but now let’s take a look at dynamically-sized cells:
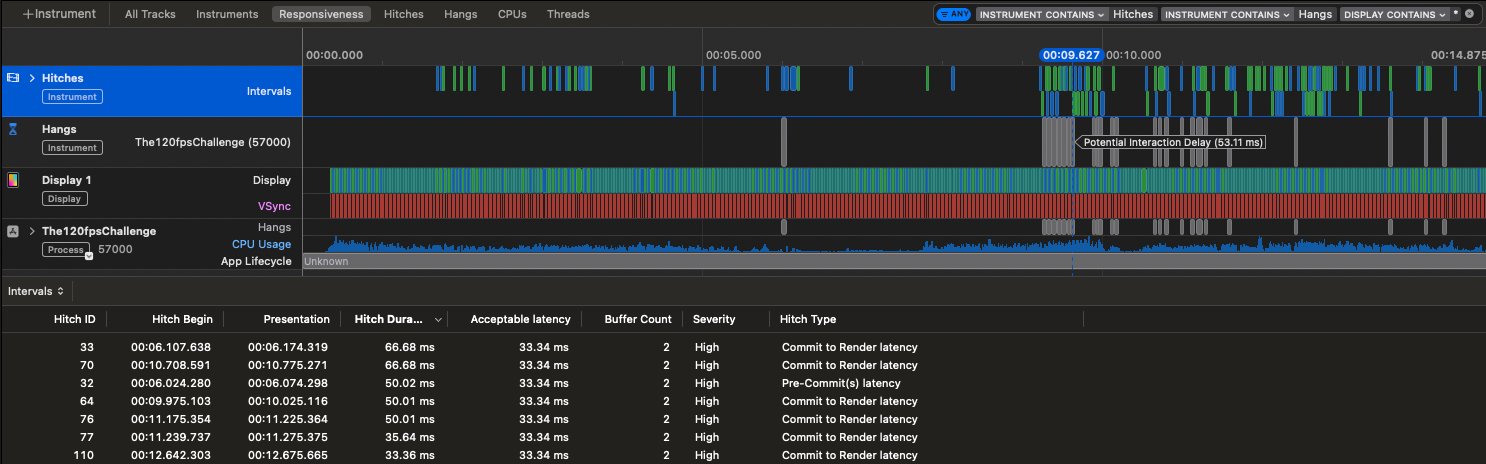
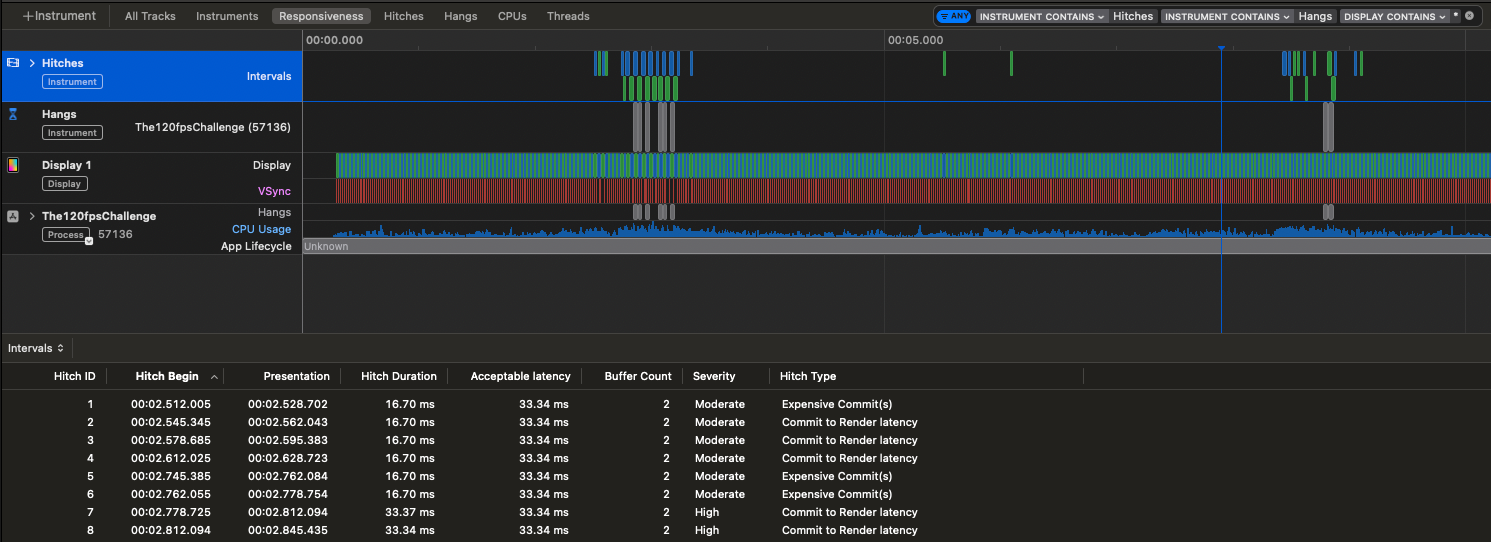
Now we see a visible degradation in performance, with several dropped frames.
In case you don’t have perfect vision, or the Substack video compression is getting you down, here’s the trace showing these dropped frames and micro-hangs. Overall, though, it wasn’t terrible considering the unfair example I used (with random cell heights).
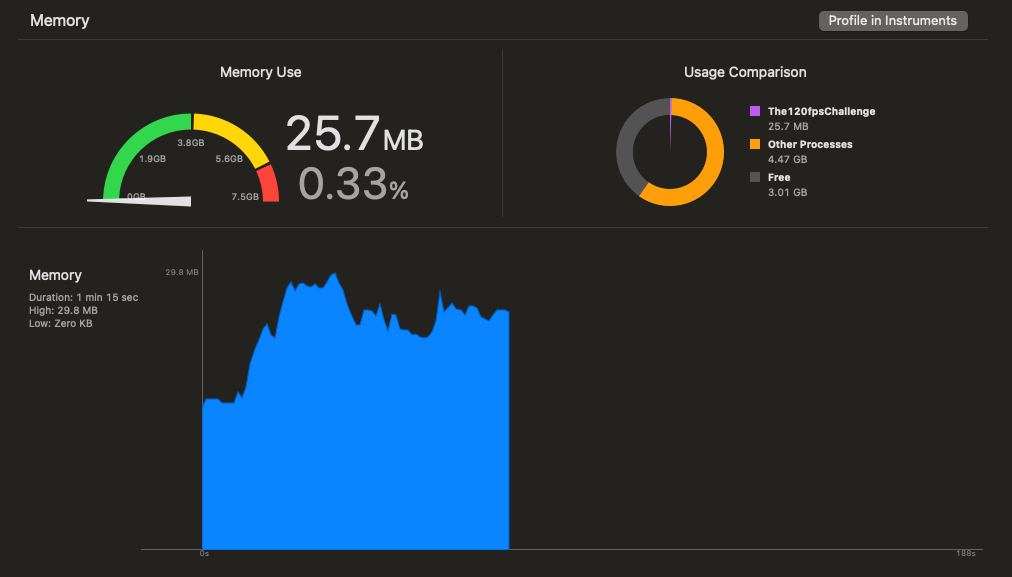
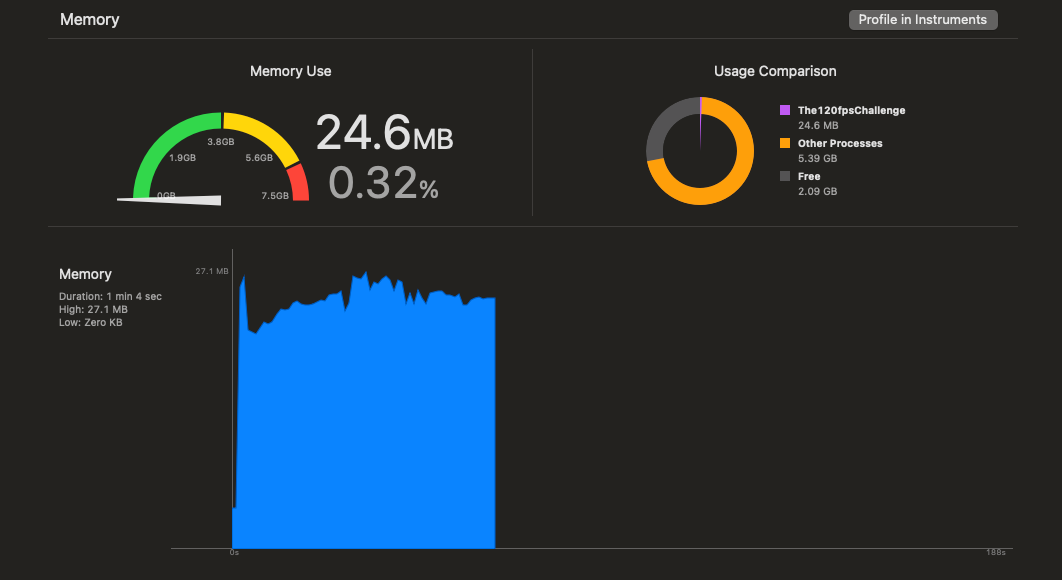
Memory usage on LazyVStack is pretty consistent. It jumped a little when I was scrolled very fast, but didn’t spike dramatically, evicting view data from memory as they scrolled past the viewport.
I was, however, able to break LazyVStack when using dynamic-sized cells.
When I dragged the scroll indicator to scroll up and down frantically, the LazyVStack dynamic height estimation crapped out. It started glitching, causing our scrolling to jump wildly on its own, and spiked memory usage.
This profile massively exceeded my expectations.
I’ve read before that LazyVStack is only lazy one-way; so cells stick around in memory indefinitely after appearing, causing scrolling to gradually get slower and slower.
To sate my curiosity, I installed the iOS 16.0 SDK and re-ran my profiling. As expected, I observed this growth in memory usage (and degradation in performance) the further we scrolled.
LazyVStack has evidently been upgraded under the hood since iOS 16, to become lazy in both directions.
Now let’s come to the Elvis of SwiftUI containers: the List.
It’s so good, it’s almost like using UIKit.
Because, uh… it’s totally UIKit.
List uses UICollectionView under the hood, including all the cell recycling that we know and love.
It’s a little more annoying to format the List, since we are sitting on top of underlying UIKit system defaults rather than given the full freedom of SwiftUI.
Let’s run it.
…
It just feels smoother. Almost buttery.
While it’s hard to emphasise this un-scientific feeling clearly, it was corroborated by this profoundly scientific Instruments trace.
No hangs. No hitches. No nuffin’. Effortless 60fps on Low Power Mode.
When dynamically sizing our cell content, I found a few one-and-two frame hitches when scrolling very fast, but certainly less than we saw with the LazyVStack.
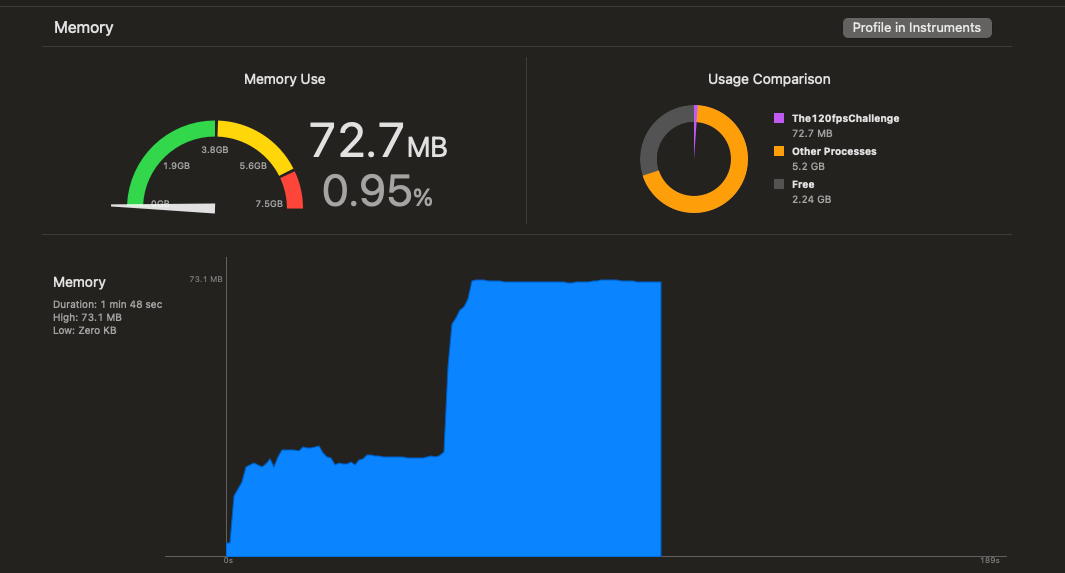
In terms of memory profile, List spiked a little when first loading, then settled into a very consistent and smooth pattern; all the way down and up the 1,000 items in the collection.
I also wasn’t able to break it.
We’ve landed on List as the most efficient way to render our infinite feed.
But when scrolling up and down, it still feels a bit clunky. Let’s look at some approaches to optimise scroll performance further:
The most obvious flaw in our example app is the images: they are eagerly-loaded every time a cell appears on-screen. This is a weakness in the SwiftUI AsyncImage component, which wastes a ton of network I/O when re-rendering an image that went offscreen.
There are dozens of libraries solving this problem, like Nuke, Kingfisher, or CachedAsyncImage. When images appear to be instantly fetched (on their second render, at least), your whole app feels dramatically snappier.
When you implement pagination, instead of allocating every item at the start, we only load the first few (often 20, 50, or 100) into our screen. When you scroll close to the bottom, more data is fetched and displayed.
This is a very common pattern, especially with infinite scrolling feeds—you aren’t exactly loading infinite amounts of data, that’d be impossible. And expensive.
With LazyVStack and List, this will make your initial memory allocations and network I/O far more efficient. A smaller data source may also improve the speed of diffing if your data changes.
The SwiftUI rendering engine re-computes views when their dependencies change, such as @State properties or properties on an @Observable view model. SwiftUI runs a diffing algorithm that compares the new view body with the old structure and identity, and potentially lays out and re-draws the view if it detects a difference.
To make high performance SwiftUI views, we need to do 2 things:
Minimise dependencies in your views. Your SwiftUI views should have as little state as possible, meaning fewer re-computations and less redrawing.
Make diffing as easy and fast as possible. SwiftUI’s default diffing algorithm can be slow on complex views, but we can assist it by making our views Equatable then applying the equatable() modifier. If your view only has primitive types for dependencies, it can perform (undocumented!) memcmp-style byte-level comparisons.
In development, you can use helper functions like Self._printChanges to help debug view re-computations and track down data flow performance issues.
We want to run as little work on the main thread as possible, keeping it free to respond to user interactions. Therefore, we should be judicious about passing work to background threads, including any kind of long-running processing, image transformations, and data parsing.
SwiftUI view bodies are @MainActor by default, meaning that any work done in the view computation like string interpolation and data filtering happens on the main actor, running each time the view computes and adding up to make your app less responsive.
When invoking functions in your view models, you should also check to make sure asynchronous work isn’t being done on the main thread unexpectedly. For a primer, check out my short piece:
Why is my Task running on the main thread?
Creating a Task is the simplest way to introduce an async context to your code. Because we’re initialising them with a closure, the standard behaviour of creating a Task isn’t immediately obvious: they’ll run on the same thread they’re created on.
There are UIKit libraries such as Texture which pull a ton of view rendering and layout work into background threads, but as far as I know there is no equivalent for SwiftUI. Anyone fancy building one?
SwiftUI includes the drawingGroup() modifier, which uses Metal to render a view as a single pre-rendered texture before drawing in on-screen. This invokes the GPU to flatten complex view hierarchies into simple images.
This is a great option if you have a complex set of animations, a deep hierarchy of nested views, or are heavily utilising CoreImage blend modes.
Uploading the view to the GPU incurs overhead. While this modifier can magically fix some performance issues, it can actually slow down your view in some instances. Consider it when responding to a performance problem rather than pre-emptively applying it to all your views.
For your own app, I recommend you profile it to look for any computational bottlenecks that might be hindering performance. You might want to use instruments such as View Body, View Properties, Core Animation Commits, Hangs, and of course the Time Profiler.
The Time Profiler
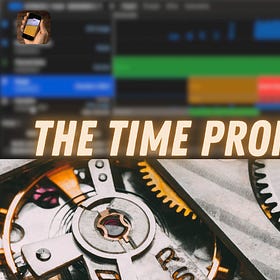
If you want a high-performance iOS app, Instruments has you covered. The Time Profiler is your bread-and-butter profiling tool. It’ll help you track down and eliminate the bottlenecks in your code. If you’re noticing animation hitches, overheating, or sluggish responsiveness, the Time Profiler can pinpoint the problem down to the
SwiftUI is a tricky beast.
The magic of its declarative syntax and powerful data flow makes building apps faster and easier than ever. On the downside, it can feel limited when you run into the cold, harsh reality of hitches and performance problems.
Infinite feeds are the hardest thing to get right in SwiftUI.
As of iOS 18, both List and LazyVStack have pretty good performance, memory use, and cell recycling, with the UICollectionView-backed List edging ahead on stability with dynamically-sized content.
Once you have your scroll view set up, there are a plethora of tricks you can apply to bring performance to the max: caching, pagination, hardware acceleration, and background processing. You should also structure your views and data flow thoughtfully, preventing unnecessary view re-computations and re-renders. This can be done by minimising the state in each view, and making your views Equatable where possible.
Every app is different. As I like to say, profile your app before you listen to some guy on the internet.
Feel free to check out the open-source repo I used if you want to perform your own analysis.
I’m standing on the shoulders of giants. This post was heavily influenced by the work of Thomas Ricouard and Fatbobman. Cheers to you both 🍻
Thanks for Reading Jacob’s Tech Tavern! 🍺
If you enjoyed this, please consider paying me. Full subscribers to Jacob’s Tech Tavern unlock Quick Hacks, my advanced tips series, and enjoy my long-form articles 3 weeks before anyone else.